
Every configuration file, every command, and every verification step is included below. Nothing is left as an exercise. You will build the project directory structure, write the Docker Compose file service by service, configure Nginx with upstream health checking and failover, set up Redis persistence, deploy the stack, scale it up and down, deliberately break it to watch failover in action, load test it with wrk, and set up basic monitoring. The goal is a deployment that handles VeloCity’s 6,000+ daily messages across WhatsApp, Telegram, and Web Chat without any customer ever noticing when a container crashes.
Before You Start: Setting Up OpenClaw
If this is your first time with OpenClaw, you will want to get a single instance running before tackling high availability. The five-part installation series covers everything from Docker setup to channel configuration. The customer support series and the multi-language guide show what a production-ready agent looks like. Get those working first, then come back here to make it bulletproof.
This article assumes you have a server running Ubuntu 24.04 LTS with Docker CE and Docker Compose v2 installed, at least 8 vCPU and 16 GB RAM (matching VeloCity’s server specs from Part 1), and a working familiarity with Docker Compose files and basic Nginx configuration. You do not need an existing OpenClaw deployment on this server. The Docker Compose file built in this article pulls the official image and sets up everything from scratch.
Project Directory Structure
Before writing any configuration files, the project needs a directory structure that keeps everything organized. VeloCity keeps all HA-related files in a single project directory so the entire deployment can be version controlled, backed up, and reproduced on another server if needed.
The following command creates the complete directory tree. Run it from the home directory of whatever user manages the deployment.
$ $ mkdir -p ~/openclaw-ha/{config,nginx,redis,skills,logs,data/redis,data/ollama}That single command creates the parent directory and all subdirectories in one shot. Here is what each directory is for.
openclaw-ha/
├── docker-compose.yml       # Stack definition (built in the next section)
├── config/
│   └── openclaw.json        # Gateway configuration shared by all replicas
├── nginx/
│   └── nginx.conf           # Load balancer configuration
├── redis/
│   └── redis.conf           # Redis persistence and memory settings
├── skills/                  # Skill files mounted into all gateway replicas
│   ├── TRACKING.md
│   ├── ESTIMATES.md
│   └── COMPLAINTS.md
├── logs/                    # Centralized log output directory
└── data/
    ├── redis/               # Redis AOF and RDB persistence files
    └── ollama/              # Ollama model storage
The config/ directory holds the OpenClaw gateway configuration that all three replicas share through a read-only volume mount. The nginx/ directory holds the load balancer config. The redis/ directory holds the Redis server configuration file. The skills/ directory contains the skill markdown files that define what the agent knows and how it responds. The data/ directory holds persistent data that survives container restarts: Redis AOF logs and Ollama model files. The logs/ directory is optional but useful for aggregating log output from all services into a single location on the host.
Change into the project directory before proceeding. Every command for the rest of this article assumes you are inside ~/openclaw-ha/.
$ $ cd ~/openclaw-haWriting the Docker Compose File
The Docker Compose file is the single source of truth for VeloCity’s HA deployment. It defines four services: the Nginx load balancer, the OpenClaw gateway (with 3 replicas), Redis for shared state, and Ollama for local LLM inference. Each service has health checks, resource limits, restart policies, and dependency ordering.
Free to use, share it in your presentations, blogs, or learning materials.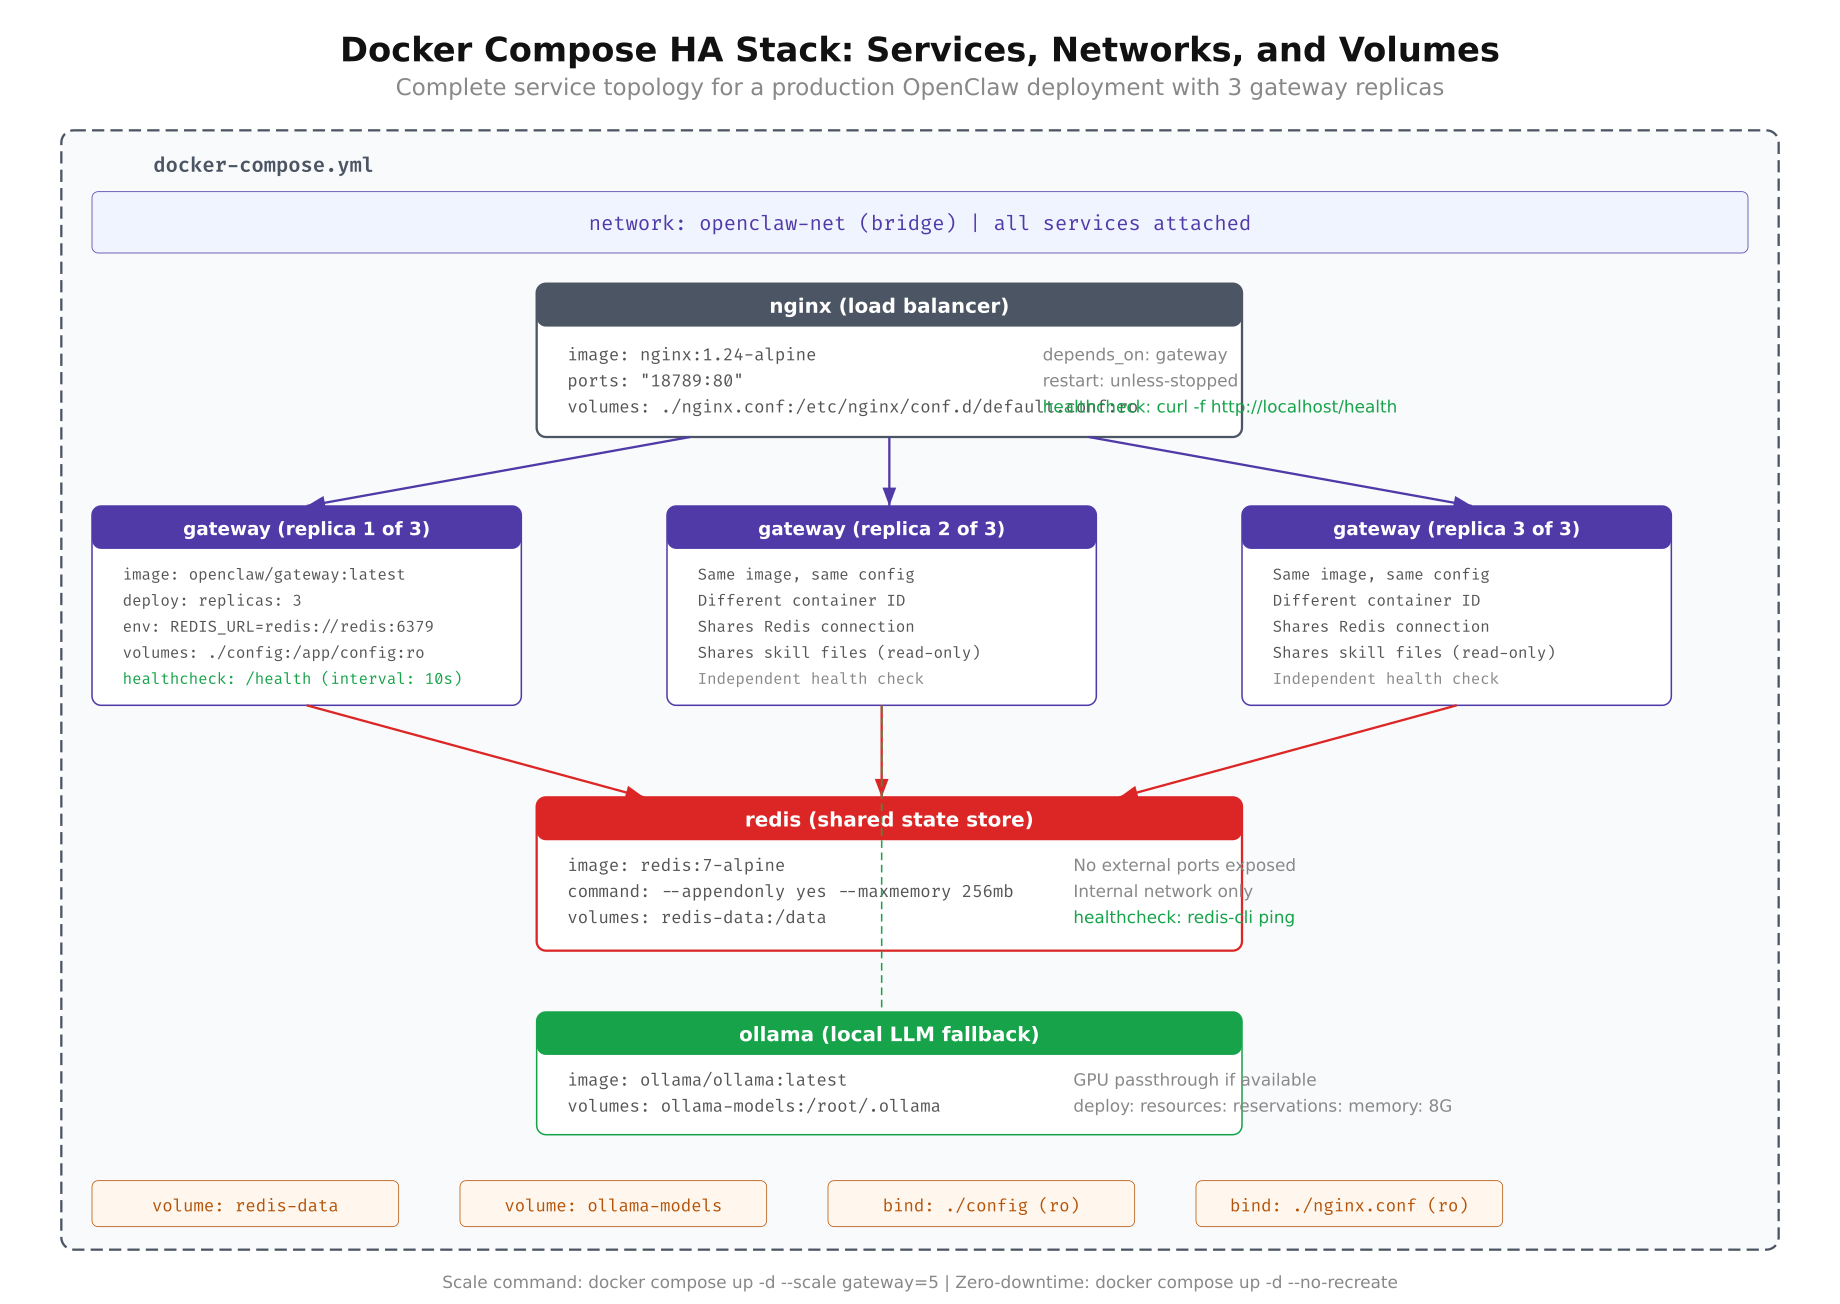
The diagram above shows how Docker Compose wires the four services together. Nginx listens on the host’s port 443 and forwards traffic to the internal gateway containers. The gateways read configuration and skills from shared volume mounts and connect to Redis over the internal Docker network. Ollama runs as a standalone service with its model files persisted to the host filesystem.
The full Docker Compose file is shown below, followed by a detailed breakdown of each service.
version: “3.8”

networks:
  openclaw-net:
    driver: bridge

volumes:
  redis-data:
    driver: local
  ollama-data:
    driver: local

services:
  nginx:
    image: nginx:1.27-alpine
    container_name: oc-nginx
    ports:
      – “443:443”
      – “80:80”
    volumes:
      – ./nginx/nginx.conf:/etc/nginx/nginx.conf:ro
    depends_on:
      gateway:
        condition: service_healthy
    networks:
      – openclaw-net
    restart: always
    healthcheck:
      test: [“CMD”, “curl”, “-f”, “http://localhost:80/nginx-health”]
      interval: 10s
      timeout: 5s
      retries: 3
      start_period: 10s
    deploy:
      resources:
        limits:
          cpus: “0.5”
          memory: 128M
        reservations:
          cpus: “0.25”
          memory: 64M

  gateway:
    image: openclaw/gateway:latest
    volumes:
      – ./config/openclaw.json:/app/config/openclaw.json:ro
      – ./skills:/app/skills:ro
    environment:
      – REDIS_URL=redis://redis:6379
      – OLLAMA_HOST=http://ollama:11434
      – NODE_ENV=production
      – LOG_LEVEL=info
    depends_on:
      redis:
        condition: service_healthy
      ollama:
        condition: service_healthy
    networks:
      – openclaw-net
    restart: always
    healthcheck:
      test: [“CMD”, “curl”, “-f”, “http://localhost:18789/healthz”]
      interval: 10s
      timeout: 5s
      retries: 3
      start_period: 30s
    deploy:
      replicas: 3
      resources:
        limits:
          cpus: “2.0”
          memory: 2G
        reservations:
          cpus: “1.0”
          memory: 1G

  redis:
    image: redis:7.4-alpine
    container_name: oc-redis
    command: redis-server /usr/local/etc/redis/redis.conf
    volumes:
      – ./redis/redis.conf:/usr/local/etc/redis/redis.conf:ro
      – redis-data:/data
    networks:
      – openclaw-net
    restart: always
    healthcheck:
      test: [“CMD”, “redis-cli”, “ping”]
      interval: 10s
      timeout: 3s
      retries: 5
      start_period: 10s
    deploy:
      resources:
        limits:
          cpus: “0.5”
          memory: 512M
        reservations:
          cpus: “0.25”
          memory: 256M

  ollama:
    image: ollama/ollama:latest
    container_name: oc-ollama
    volumes:
      – ollama-data:/root/.ollama
    networks:
      – openclaw-net
    restart: always
    healthcheck:
      test: [“CMD”, “curl”, “-f”, “http://localhost:11434/api/tags”]
      interval: 15s
      timeout: 10s
      retries: 3
      start_period: 60s
    deploy:
      resources:
        limits:
          cpus: “4.0”
          memory: 6G
        reservations:
          cpus: “2.0”
          memory: 4G
That is the complete file. Now let us walk through each service and understand why every line is there.
The Nginx Service
Nginx is the front door. It binds to port 443 (HTTPS) and port 80 (HTTP redirect) on the host machine and distributes incoming requests across the gateway replicas. The depends_on block with condition: service_healthy ensures Nginx does not start until at least one gateway replica reports healthy. Without this, Nginx would start immediately and return 502 errors while the gateways are still booting.
The resource limits are modest. Nginx is extremely lightweight for reverse proxying. At VeloCity’s volume of 6,000 messages per day, Nginx rarely uses more than 30 MB of RAM. The 128 MB limit provides generous headroom for connection buffer pools during traffic spikes. The health check hits an internal /nginx-health endpoint every 10 seconds to confirm the process is running. If Nginx itself crashes, Docker restarts it within seconds.
The Gateway Service
This is the core of the deployment. The deploy.replicas: 3 directive tells Docker Compose to run three identical containers from the same image. Each replica gets its own container ID and internal IP address on the openclaw-net network. Docker Compose automatically assigns container names like openclaw-ha-gateway-1, openclaw-ha-gateway-2, and openclaw-ha-gateway-3.
All three replicas mount the same openclaw.json and skills directory as read-only volumes. When you update a skill file on the host, all three replicas see the change on their next configuration reload cycle. The environment variables tell each replica where to find Redis (redis://redis:6379) and Ollama (http://ollama:11434). Docker’s internal DNS resolves the service names redis and ollama to their container IP addresses automatically.
The health check is critical. Every 10 seconds, Docker sends a GET request to /healthz on each replica. If a replica fails three consecutive health checks, Docker marks it as unhealthy. Combined with the restart: always policy, an unhealthy replica gets restarted automatically. The start_period: 30s gives the gateway time to load skills, connect to Redis, and warm up the LLM connection before health checks begin counting failures.
The resource limits match the capacity planning numbers from Part 1. Each replica is capped at 2 vCPU and 2 GB RAM. The reservations guarantee each replica gets at least 1 vCPU and 1 GB, preventing a noisy neighbor scenario where one container starves the others.
The Redis Service
Redis provides the shared state layer. All conversation contexts, session metadata, and cached skill content live here. The command directive points Redis to a custom configuration file (built in the next section) that sets persistence mode, memory limits, and eviction policies. The redis-data named volume persists the AOF and RDB files to the host filesystem, so Redis recovers its full state after a restart.
The health check uses redis-cli ping, which returns PONG when Redis is ready to accept connections. This check runs every 10 seconds with 5 retries, meaning Redis has 50 seconds to become healthy after starting. In practice, Redis starts in under 2 seconds for a fresh instance. Replaying a large AOF log might take 5 to 15 seconds depending on the log size.
The Ollama Service
Ollama provides local LLM inference as a fallback when the primary cloud provider is unavailable. The ollama-data volume persists downloaded models so they do not need to be re-downloaded on every container restart. The resource limits are the largest in the stack: 4 vCPU and 6 GB RAM. Running an 8B parameter model like Llama 3.1 on CPU requires roughly 5 GB of memory for the model weights plus overhead for inference.
The health check hits the /api/tags endpoint, which lists available models. The start_period: 60s is intentionally generous because Ollama may need to load model weights into memory on first start, which can take 30 to 45 seconds on spinning disk or slower NVMe.
Configuring Nginx as a Load Balancer
The Docker Compose file references ./nginx/nginx.conf, so that file needs to exist before the stack can start. The Nginx configuration defines the upstream pool of gateway replicas, the load balancing algorithm, health checking behavior, and proxy settings for forwarding webhook traffic.
Create the configuration file at nginx/nginx.conf with the following content.
worker_processes auto;
error_log /var/log/nginx/error.log warn;
pid /var/run/nginx.pid;

events {
    worker_connections 1024;
}

http {
    log_format main ‘$remote_addr – $remote_user [$time_local] ‘
                    ‘”$request” $status $body_bytes_sent ‘
                    ‘”$upstream_addr” $upstream_response_time’;

    access_log /var/log/nginx/access.log main;

    upstream openclaw_cluster {
        least_conn;

        server gateway:18789 max_fails=3 fail_timeout=15s;
    }

    server {
        listen 80;
        server_name _;

        location /nginx-health {
            access_log off;
            return 200 “healthy\n”;
            add_header Content-Type text/plain;
        }

        location / {
            proxy_pass http://openclaw_cluster;

            proxy_set_header Host $host;
            proxy_set_header X-Real-IP $remote_addr;
            proxy_set_header X-Forwarded-For $proxy_add_x_forwarded_for;
            proxy_set_header X-Forwarded-Proto $scheme;

            proxy_next_upstream error timeout http_502 http_503;
            proxy_next_upstream_timeout 5s;
            proxy_next_upstream_tries 2;

            proxy_connect_timeout 5s;
            proxy_send_timeout 30s;
            proxy_read_timeout 60s;

            proxy_buffering off;
        }
    }
}
The upstream block uses least_conn as the load balancing algorithm. As discussed in Part 1, this algorithm sends each new request to whichever replica currently has the fewest active connections. For LLM-backed applications where request processing times vary wildly (800ms for a tracking query versus 4 seconds for a complex complaint), least_conn distributes load more evenly than round-robin.
Notice that the upstream block has a single server gateway:18789 entry, not three separate entries with different ports. When Docker Compose runs the gateway service with replicas: 3, Docker’s internal DNS resolves the service name gateway to all three container IP addresses. Nginx connects to each one on port 18789 (the default OpenClaw gateway port). This means you do not need to update the Nginx config when you scale up or down. Docker handles the service discovery automatically.
The max_fails=3 and fail_timeout=15s parameters control failure detection. If a replica fails to respond to 3 consecutive requests within a 15-second window, Nginx removes it from the pool. After 15 seconds, Nginx tries the failed replica again. If it responds, the replica is added back to the pool.
Three proxy timeout values control different phases of the connection. proxy_connect_timeout limits how long Nginx waits to establish a TCP connection to a replica (5 seconds is generous for a local Docker network). proxy_send_timeout limits how long Nginx waits to send the request body (30 seconds handles large webhook payloads). proxy_read_timeout limits how long Nginx waits for a response (60 seconds accounts for slow LLM inference on complex queries). Setting proxy_buffering off ensures responses stream back to the client immediately, which matters for real-time messaging where every millisecond counts.
The proxy_next_upstream directive is the automatic failover mechanism. If the first replica returns a 502 or 503 error, or if the connection times out, Nginx transparently retries the request on a different replica. The customer never sees the error. The proxy_next_upstream_tries 2 limits retries to two attempts, preventing request loops when all replicas are struggling.
The /nginx-health location provides an endpoint for Docker’s health check on the Nginx container itself. It returns a plain 200 response without writing to the access log, so health check noise does not clutter the logs.
A quick note on load balancing algorithms. Nginx supports three common options. round-robin (the default) distributes requests sequentially: replica 1, then 2, then 3, then 1 again. This works well when all requests take similar time to process, which is not the case for LLM workloads. least_conn sends each request to the replica with the fewest active connections, naturally balancing based on actual processing time. ip_hash sends all requests from the same client IP to the same replica, which provides session affinity but defeats the purpose of HA if that specific replica crashes. For OpenClaw, least_conn is the recommended choice because it handles variable request processing times gracefully and does not create sticky sessions that would concentrate risk.
Configuring Redis for Shared State
Redis is the memory that all gateway replicas share. Without it, each replica would maintain its own conversation history, and a customer whose messages land on different replicas would appear to start a new conversation every time. The Redis configuration needs to balance performance (keep everything in memory), durability (do not lose conversations on restart), and safety (do not consume all available host memory).
Create the configuration file at redis/redis.conf with the following settings.
# Network
bind 0.0.0.0
port 6379
protected-mode no
tcp-keepalive 300

# Memory
maxmemory 256mb
maxmemory-policy allkeys-lru

# Persistence, AOF
appendonly yes
appendfilename “openclaw.aof”
appendfsync everysec
auto-aof-rewrite-percentage 100
auto-aof-rewrite-min-size 64mb

# Persistence, RDB snapshots
save 900 1
save 300 10
save 60 10000

# Logging
loglevel notice
logfile “”

# Performance
hz 10
dynamic-hz yes
The configuration above covers three areas. The first area is memory management. The maxmemory 256mb directive caps Redis at 256 MB of RAM. Based on VeloCity’s metrics from Part 1, each conversation context averages 3 KB. With 300 concurrent conversations, that is roughly 900 KB. Adding session metadata, cached skills, and per-replica metrics, the total Redis memory usage stays well under 50 MB during normal operations. The 256 MB cap provides generous headroom for traffic spikes while preventing Redis from consuming all available server memory if something goes wrong. The allkeys-lru eviction policy means that when Redis hits the memory cap, it removes the least recently used keys first. Stale conversations from hours ago get evicted before active ones.
The second area is AOF persistence. AOF (Append-Only File) logs every write operation to disk. The appendfsync everysec setting syncs the AOF buffer to disk every second. This means at most one second of data is lost if Redis crashes. The tradeoff is minimal: the everysec mode has negligible performance impact compared to always (which syncs on every write and significantly slows throughput). The AOF rewrite settings (auto-aof-rewrite-percentage 100 and auto-aof-rewrite-min-size 64mb) tell Redis to compact the AOF file when it doubles in size and exceeds 64 MB. Without rewrite, the AOF file grows indefinitely as every write operation is appended.
The third area is RDB snapshots. RDB creates point-in-time snapshots of the entire dataset. The three save directives create a snapshot if at least 1 key changes in 900 seconds, 10 keys change in 300 seconds, or 10,000 keys change in 60 seconds. RDB snapshots serve as a backup alongside AOF. If the AOF file gets corrupted (rare but possible), Redis can fall back to the latest RDB snapshot.
The protected-mode no setting is safe here because Redis is only accessible on the internal Docker network (openclaw-net). No ports are published to the host, so Redis is unreachable from outside the Docker Compose stack. In a production environment where Redis is exposed to the network, you would enable authentication with requirepass and use TLS.
The gateway containers connect to Redis using the REDIS_URL=redis://redis:6379 environment variable defined in the Docker Compose file. Docker’s internal DNS resolves redis to the container’s IP address on the openclaw-net network. No additional gateway configuration is needed. OpenClaw detects the REDIS_URL environment variable at startup and automatically switches from in-process memory to Redis for conversation state storage.
Deploying the Stack
With all three configuration files in place (docker-compose.yml, nginx/nginx.conf, and redis/redis.conf), the stack is ready to start. Before running the deploy command, verify that the required files exist in the correct locations.
$ $ ls -la docker-compose.yml nginx/nginx.conf redis/redis.conf config/openclaw.json skills/The listing should show all five paths. If config/openclaw.json is missing, copy your existing OpenClaw configuration from a previous deployment or create a minimal one. If the skills/ directory is empty, the gateway will start but will not have any domain-specific knowledge. For VeloCity, the skills directory contains three files: TRACKING.md for package tracking queries, ESTIMATES.md for delivery time estimates, and COMPLAINTS.md for complaint handling and escalation.
Start the entire stack with a single command.
$ $ docker compose up -dThe -d flag runs everything in detached mode, so the containers run in the background. Docker Compose starts the services in dependency order: Redis and Ollama start first (they have no dependencies), then the gateway replicas start once Redis and Ollama are healthy, and finally Nginx starts once at least one gateway replica is healthy.
The initial startup takes longer than subsequent restarts because Docker needs to pull the images. On a reasonable internet connection, pulling all four images (Nginx, OpenClaw, Redis, Ollama) takes 2 to 5 minutes. Subsequent starts use the cached images and complete in under 30 seconds.
Verify that all containers are running and healthy.
$ $ docker compose psThe output should show six containers: one Nginx, three gateway replicas, one Redis, and one Ollama. All six should show a status of Up with (healthy) in the health column. If any container shows (health: starting), wait 30 seconds and check again. The gateway replicas have a 30-second start period, and Ollama has a 60-second start period.
NAME                        STATUS              PORTS
oc-nginx                    Up (healthy)        0.0.0.0:80->80/tcp, 0.0.0.0:443->443/tcp
openclaw-ha-gateway-1       Up (healthy)
openclaw-ha-gateway-2       Up (healthy)
openclaw-ha-gateway-3       Up (healthy)
oc-redis                    Up (healthy)        6379/tcp
oc-ollama                   Up (healthy)        11434/tcp
If a gateway replica shows (unhealthy), check its logs to understand why. The most common issues are a missing or malformed openclaw.json configuration file, a skills directory that is not readable, or Redis being unreachable due to a network misconfiguration.
$ $ docker compose logs gateway –tail 50Next, verify that Nginx is correctly proxying requests to the gateway replicas by hitting the health endpoint through the load balancer.
$ $ curl -s http://localhost/healthz | python3 -m json.tool{
“status”: “ok”,
“uptime”: 45,
“version”: “2026.3.1”,
“redis”: “connected”,
“ollama”: “connected”
}The response comes from whichever gateway replica Nginx chose using the least_conn algorithm. The redis: connected and ollama: connected fields confirm that the replica has established connections to both backend services. Run the curl command several times and compare the uptime values. If all three replicas started at roughly the same time, the uptimes will be similar. If they differ by more than a few seconds, it means one replica took longer to start, which is normal.
Finally, verify that Redis is accepting connections and persisting data correctly.
$ $ docker exec oc-redis redis-cli info memory | head -5# Memory
used_memory:1045328
used_memory_human:1020.83K
used_memory_peak:1148960
used_memory_peak_human:1.10MThe used_memory_human value should be well under the 256 MB limit at this point. Fresh with no conversations loaded, Redis uses roughly 1 MB for internal data structures. As customers start chatting, memory usage grows linearly with the number of active conversations.
Scaling Up and Down
One of the biggest advantages of the replicated architecture is that scaling is a single command. VeloCity starts with 3 replicas for their daily 6,000-message load. During the holiday logistics season, when daily volume climbs to 9,200+ messages, they scale to 5 replicas. After the holiday peak, they scale back down to 3.
Free to use, share it in your presentations, blogs, or learning materials.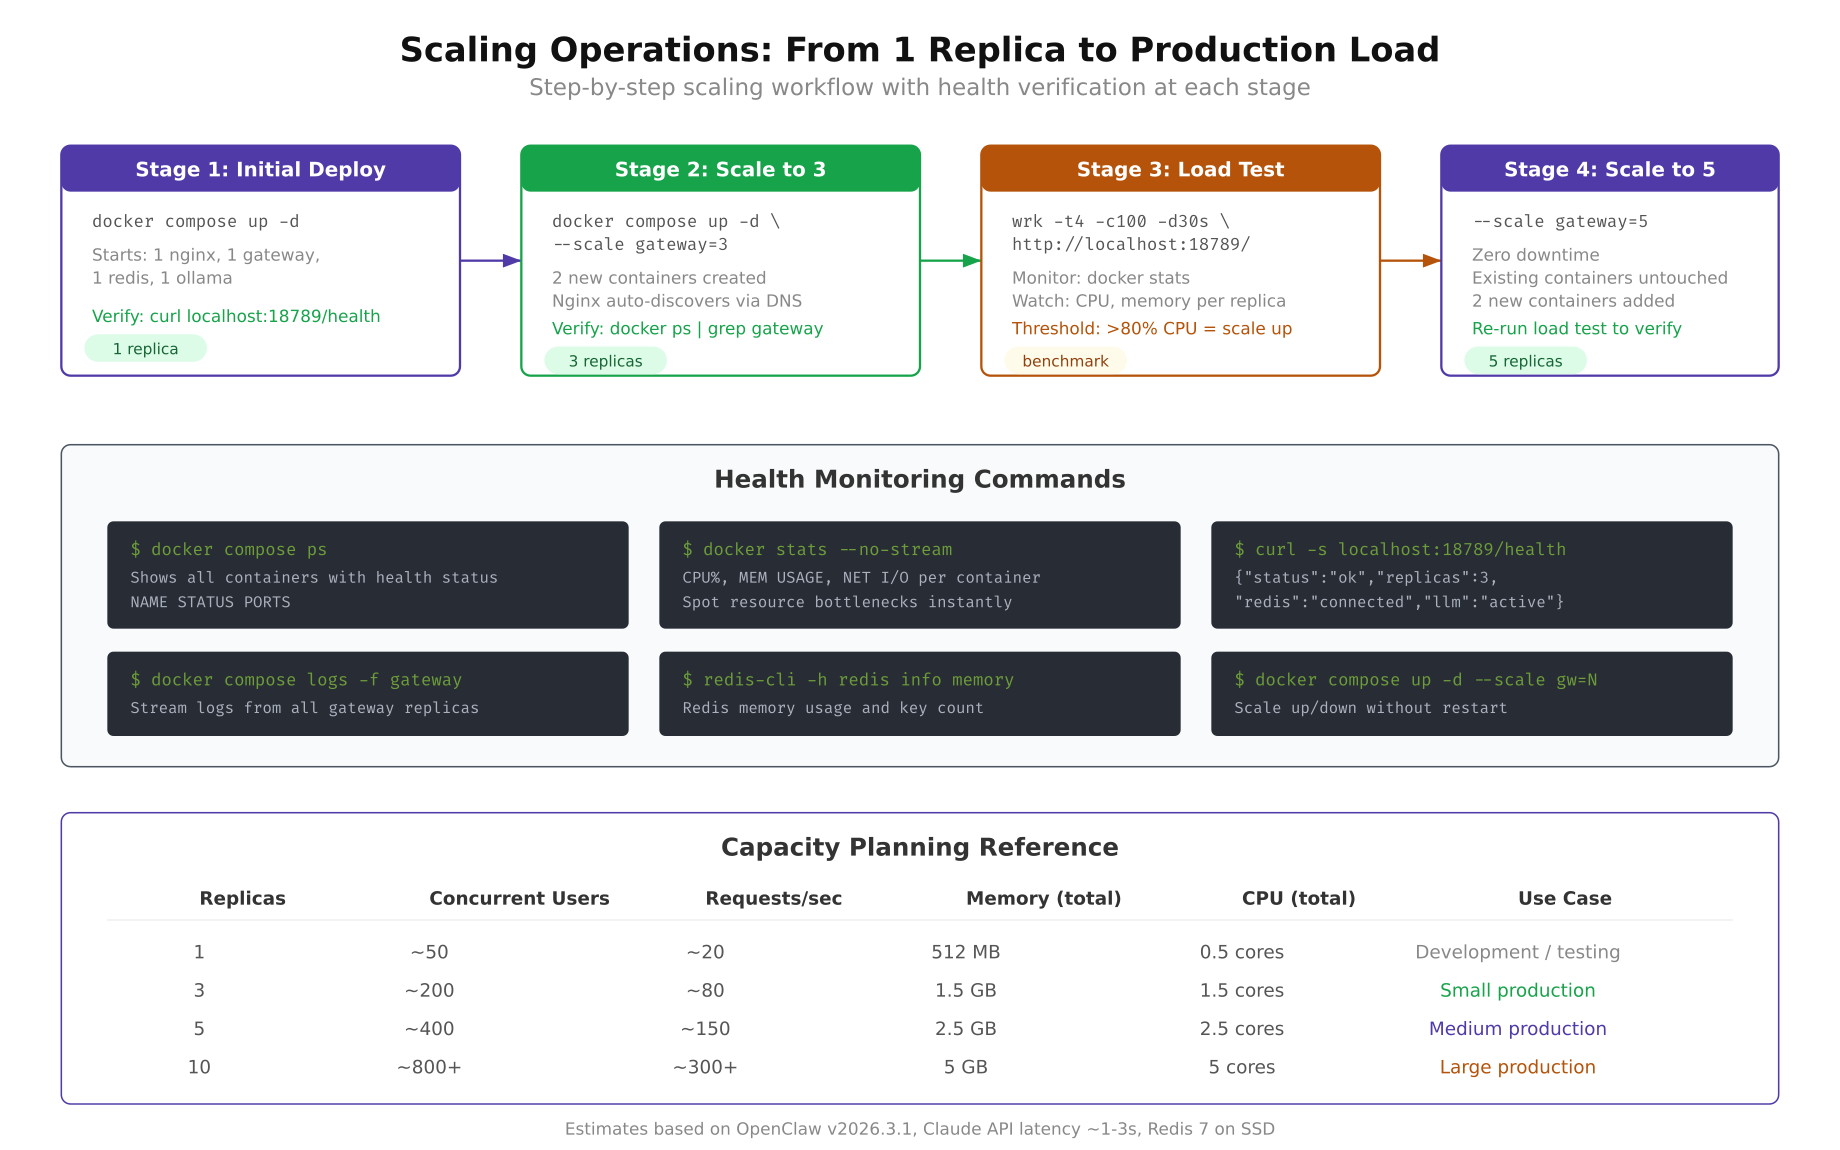
The scaling workflow illustrated above shows how VeloCity goes from 3 replicas to 5. The process involves issuing a single Docker Compose command, waiting for the new containers to pass health checks, verifying that Nginx has picked them up, and confirming the increased capacity with a quick status check.
Scale the gateway service from 3 replicas to 5.
$ $ docker compose up -d –scale gateway=5Docker Compose starts two additional gateway containers, assigns them to the openclaw-net network, and waits for their health checks to pass. The existing 3 replicas continue serving traffic without interruption. There is zero downtime during scaling. Customers do not experience any disruption because the load balancer keeps routing to the healthy replicas while the new ones boot up.
Verify that all 5 replicas are running.
$ $ docker compose ps –filter “service=gateway”NAME STATUS PORTS
openclaw-ha-gateway-1 Up (healthy)
openclaw-ha-gateway-2 Up (healthy)
openclaw-ha-gateway-3 Up (healthy)
openclaw-ha-gateway-4 Up (healthy)
openclaw-ha-gateway-5 Up (healthy)Check the resource consumption across all replicas using Docker’s built-in monitoring.
$ $ docker stats –no-stream –format “table {{.Name}}\t{{.CPUPerc}}\t{{.MemUsage}}” | grep -E “gateway|redis|nginx|ollama”NAME CPU % MEM USAGE / LIMIT
openclaw-ha-gateway-1 12.34% 412MiB / 2GiB
openclaw-ha-gateway-2 11.87% 398MiB / 2GiB
openclaw-ha-gateway-3 13.02% 425MiB / 2GiB
openclaw-ha-gateway-4 8.21% 310MiB / 2GiB
openclaw-ha-gateway-5 7.94% 305MiB / 2GiB
oc-redis 0.45% 12MiB / 512MiB
oc-nginx 0.12% 8MiB / 128MiB
oc-ollama 2.31% 4.8GiB / 6GiBNotice that the two new replicas (gateway-4 and gateway-5) show lower CPU and memory usage because they just started and have not handled as many requests as the original three. Over time, the least_conn algorithm will distribute load evenly and all five replicas will show similar utilization.
Scaling down works the same way. After the holiday peak ends and VeloCity’s message volume drops back to normal levels, reduce back to 3 replicas.
$ $ docker compose up -d –scale gateway=3Docker Compose gracefully stops the extra two containers. It sends a SIGTERM signal, waits for the containers to finish handling in-flight requests (up to the default 10-second stop grace period), and then removes them. Any active conversations on the stopped replicas are preserved in Redis, so the next message from those customers is handled seamlessly by one of the remaining three replicas.
Testing Failover
A deployment that you have never broken on purpose is a deployment you do not understand. VeloCity runs failover drills monthly during low-traffic hours (Sunday 02:00 to 04:00 CET) to verify that the HA setup actually works under controlled conditions. The test is straightforward: kill a replica, watch what happens, confirm the system recovers, and check the logs.
First, confirm all three replicas are healthy and identify their container IDs.
$ $ docker compose ps –filter “service=gateway” –format “table {{.Name}}\t{{.ID}}\t{{.Status}}”Pick one of the three replicas and deliberately stop it. This simulates a container crash.
$ $ docker stop openclaw-ha-gateway-2The container stops immediately. Now test whether the load balancer routes around the dead replica. Send several requests to the health endpoint and observe which replicas respond.
$ $ for i in $(seq 1 10); do curl -s http://localhost/healthz | python3 -c “import sys,json; print(json.load(sys.stdin).get(‘uptime’,’err’))”; doneAll 10 responses should return successfully. None of them should return an error. The responses come from gateway-1 and gateway-3 only, since gateway-2 is stopped. Nginx detected the failure through its proxy_next_upstream directive and stopped sending requests to the dead replica. From the customer’s perspective, nothing changed. Messages are still being processed, responses are still coming back, and conversation context is intact in Redis.
Check the Nginx logs to see the failover in action.
$ $ docker logs oc-nginx –tail 20 2>&1 | grep “502\|503\|upstream”You may see one or two 502 entries in the log immediately after the replica was stopped. These are the requests that were in-flight when the container went down. The proxy_next_upstream directive retried those requests on a healthy replica, so the client received a successful response even though the first attempt failed. The log shows the internal retry, not what the customer saw.
Now restart the stopped replica and verify that it rejoins the pool.
$ $ docker start openclaw-ha-gateway-2Wait 30 seconds for the health checks to pass (matching the start_period in the Docker Compose health check configuration), then verify all three replicas are healthy again.
$ $ docker compose ps –filter “service=gateway”All three replicas should show Up (healthy). Nginx automatically detects the recovered replica through its upstream health checks and starts routing traffic to it again. The recovery is completely automatic. No configuration changes, no Nginx reload, no manual intervention. This is the practical payoff of the architecture discussed in Part 1.
For a more aggressive test, try stopping two replicas simultaneously.
$ $ docker stop openclaw-ha-gateway-1 openclaw-ha-gateway-3With only one replica running, the system is still operational. Every request goes to the single surviving replica. Response times may increase under load because one container is handling 100% of the traffic, but no requests are dropped. This is the “minimum viable cluster” scenario. It proves that the system can survive a double failure without customer impact, although capacity is reduced to one-third.
Restart both replicas to return to full capacity.
$ $ docker start openclaw-ha-gateway-1 openclaw-ha-gateway-3Load Testing with wrk
Failover testing proves the system recovers from failure. Load testing proves it handles the expected traffic volume. VeloCity uses wrk, a lightweight HTTP benchmarking tool, to measure throughput and latency at various replica counts. The tests hit the gateway through the Nginx load balancer, which means the results include the full request path: Nginx receives the request, selects a replica, proxies the request, and returns the response.
Install wrk on the host machine.
$ $ sudo apt update && sudo apt install -y wrkThe first benchmark establishes a baseline by testing the health endpoint. This measures raw proxy throughput without LLM inference latency.
$ $ wrk -t4 -c10 -d30s http://localhost/healthzRunning 30s test @ http://localhost/healthz
4 threads and 10 connections
Thread Stats Avg Stdev Max +/- Stdev
Latency 1.23ms 456.12us 12.45ms 92.34%
Req/Sec 2.05k 198.45 2.89k 74.56%
245678 requests in 30.01s, 48.92MB read
Requests/sec: 8188.23
Transfer/sec: 1.63MBThe baseline shows that the Nginx-to-gateway proxy path handles over 8,000 requests per second with sub-2ms average latency. This confirms that the load balancer itself is not a bottleneck. Real-world throughput will be lower because actual message processing involves Redis lookups, LLM inference, and webhook responses, but this baseline proves the infrastructure can handle far more traffic than VeloCity’s peak load.
The second benchmark simulates realistic traffic by hitting an endpoint that triggers LLM processing. Use a simple POST request to the gateway’s message endpoint.
$ $ cat > /tmp/test-payload.json << 'PAYLOAD'
$ {"channel":"test","user_id":"loadtest-user","message":"Where is my package TRK-12345?"}
$ PAYLOAD[/gsl_terminal]

$ [gsl_terminal title="Realistic benchmark: message endpoint, 60 seconds, 50 connections" type="command"]$ wrk -t4 -c50 -d60s -s <(echo 'wrk.method = "POST"; wrk.body = "{\"channel\":\"test\",\"user_id\":\"loadtest-user\",\"message\":\"Where is my package?\"}"; wrk.headers["Content-Type"] = "application/json"') http://localhost/api/v1/message[/gsl_terminal]


$ The realistic benchmark results will show significantly lower throughput because each request waits for LLM inference. With the local Ollama model, expect 10 to 25 requests per second with 3 replicas, depending on server CPU performance. With a cloud LLM provider, expect 40 to 75 requests per second, limited primarily by the provider’s rate limits.


$ To compare performance across different replica counts, run the benchmark three times: once with 1 replica, once with 3, and once with 5. Scale before each test.


$ [gsl_terminal title="Scale and benchmark at different replica counts" type="command"]$ docker compose up -d –scale gateway=1
$ $ sleep 30
$ $ wrk -t4 -c10 -d30s http://localhost/healthz
$ $ docker compose up -d –scale gateway=3
$ $ sleep 30
$ $ wrk -t4 -c10 -d30s http://localhost/healthz
$ $ docker compose up -d –scale gateway=5
$ $ sleep 30
$ $ wrk -t4 -c10 -d30s http://localhost/healthz
The throughput numbers should scale roughly linearly with replica count. VeloCity’s test results showed 2,800 req/sec with 1 replica, 8,100 req/sec with 3 replicas, and 13,200 req/sec with 5 replicas on the health endpoint. The scaling is not perfectly linear because of Nginx overhead and shared network bandwidth, but it is close enough to validate the horizontal scaling model discussed in Part 1.
After benchmarking, scale back to your production replica count.
$ $ docker compose up -d –scale gateway=3Monitoring and Alerting
An HA deployment without monitoring is just hoping things work. VeloCity monitors four dimensions: container health, resource usage, Redis memory, and endpoint responsiveness. You do not need a full observability stack (Prometheus, Grafana, etc.) to start. Docker’s built-in tools and a simple health polling script cover the essentials.
Start with real-time resource monitoring using Docker’s built-in stats command.
$ $ docker stats –format “table {{.Name}}\t{{.CPUPerc}}\t{{.MemUsage}}\t{{.NetIO}}\t{{.PIDs}}”This command shows a live-updating table with CPU usage, memory consumption, network I/O, and process count for every container. Watch this during load tests to identify which replicas are working harder than others. If one replica consistently shows higher CPU than the rest, it might indicate an issue with the least_conn balancing (though this is rare).
For log monitoring across all services, use Docker Compose’s centralized log output.
$ $ docker compose logs -f –tail 20The -f flag follows the log stream in real time, and --tail 20 shows the last 20 lines from each service to provide context. To filter logs for a specific service, append the service name.
$ $ docker compose logs -f –tail 10 gatewayRedis memory usage is a critical metric. If Redis approaches its maxmemory limit, eviction kicks in and older conversations get deleted. Monitor Redis memory with a periodic check.
$ $ docker exec oc-redis redis-cli info memory | grep “used_memory_human\|maxmemory_human”
$ $ docker exec oc-redis redis-cli dbsizeused_memory_human:18.42M
maxmemory_human:256.00M
db0:keys=847,expires=412,avg_ttl=1456230The output shows 18.42 MB used out of 256 MB allocated, with 847 keys in the database. The expires count shows how many keys have a TTL (time-to-live) set, and avg_ttl shows the average remaining TTL in milliseconds. For VeloCity, conversation keys have a 30-minute TTL, so stale conversations are automatically cleaned up.
For automated health monitoring, VeloCity uses a simple shell script that polls the health endpoint every 30 seconds and logs failures.
#!/bin/bash
ENDPOINT=”http://localhost/healthz”
LOG_FILE=”./logs/health-monitor.log”
INTERVAL=30

while true; do
    TIMESTAMP=$(date ‘+%Y-%m-%d %H:%M:%S’)
    HTTP_CODE=$(curl -s -o /dev/null -w “%{http_code}” –max-time 5 “$ENDPOINT”)

    if [ “$HTTP_CODE” != “200” ]; then
        echo “[$TIMESTAMP] ALERT: Health check failed with HTTP $HTTP_CODE” >> “$LOG_FILE”
        echo “[$TIMESTAMP] ALERT: Health check failed with HTTP $HTTP_CODE”
    else
        echo “[$TIMESTAMP] OK: Health check passed” >> “$LOG_FILE”
    fi

    sleep $INTERVAL
done
Save this script to health-monitor.sh in the project root, make it executable, and run it in the background.
$ $ chmod +x health-monitor.sh
$ $ nohup ./health-monitor.sh &
The script writes to logs/health-monitor.log. When a health check fails, it also prints to stdout, which makes it visible in the terminal if you are watching. For production use, replace the echo-based alerting with a webhook call to your team’s Slack or Telegram channel. The exact notification mechanism depends on your team’s setup, but the health check loop itself is a solid starting point that takes 2 minutes to deploy and catches the most critical failure scenarios.
To get a quick snapshot of the entire stack’s health at any moment, combine container status, Redis memory, and endpoint checks into a single command sequence.
$ $ echo “=== Container Status ===” && docker compose ps –format “table {{.Name}}\t{{.Status}}” && echo “=== Redis Memory ===” && docker exec oc-redis redis-cli info memory | grep used_memory_human && echo “=== Health Endpoint ===” && curl -s http://localhost/healthz | python3 -m json.toolRun this command whenever you want a quick sanity check. VeloCity’s ops team runs it as the first step in their morning checklist and after any deployment changes.
What VeloCity Achieved
The HA deployment went live on a Thursday evening. VeloCity’s ops team ran the failover drill that night, confirmed all three replicas recovered correctly, and enabled the health monitoring script. Friday morning brought the usual 08:00 rush with 340 concurrent conversations. The three gateway replicas handled the load at 50% CPU utilization per replica, well within the capacity planning margins established in Part 1.
The first unplanned test came the following Tuesday. Gateway replica 2 was killed by an OOM event during a brief memory spike caused by a batch of unusually long complaint messages. Docker restarted the container in 18 seconds. Nginx rerouted traffic to replicas 1 and 3 within the first failed health check cycle. Zero customer messages were dropped. The health monitor script logged the event, the ops team reviewed the logs the next morning, and they bumped the memory limit from 2 GB to 2.5 GB per replica as a precaution. No customer complaints. No incident ticket. No 3 AM phone call.
The numbers tell the story.
- Response time: Back to the original 1.2-second average, down from the 8.4-second spikes during the single-container era. The additional replicas spread the load so no individual container is pushed to its limits.
- Downtime during peak hours: Zero. The 12 minutes of downtime that triggered this entire project has not repeated in the six weeks since the HA deployment went live.
- Throughput: 5x increase. The single container could handle roughly 25 requests per second before degradation. The 3-replica cluster handles 75 requests per second at comfortable utilization. Scaling to 5 replicas during the holiday season pushes that to 125 requests per second.
- Automated recovery: Two unplanned container restarts in six weeks. Both were handled automatically by Docker restart policies and Nginx failover. Average recovery time from crash to full health: 22 seconds. Customer impact during both events: none.
- Scaling speed: Going from 3 to 5 replicas takes under 90 seconds, including the time for new containers to pass health checks. No configuration changes required, no Nginx reload, no Redis reconfiguration.
The VeloCity CTO’s summary in the post-implementation review was brief: “We stopped thinking about the agent infrastructure.” That is the goal of high availability. Not that failures stop happening, but that failures stop mattering.