
This article covers measuring and mapping inter-node latency, understanding how Raft and IBFT 2.0 consensus degrade under latency, quantifying TPS loss curves, optimizing Gossip propagation across regions, evaluating endorsement policy designs for latency tolerance, and building monitoring dashboards that track consensus health in real time. The scenario simulated here is SilkRoute Digital, a cross-border trade finance consortium operating Hyperledger Fabric 2.5 with Besu settlement chains across four data centers in London, Dubai, Singapore, and Tokyo.
Mapping Inter-Node Latency Across Data Centers
Before deploying any blockchain node, you need a complete latency matrix between every data center pair. This baseline informs consensus timeout tuning, endorsement policy design, and node placement decisions. SilkRoute Digital operates four sites with significantly different latency profiles between each pair.
# Comprehensive latency measurement between all DC pairs
# Run from each DC to build the full matrix

# Install hping3 for precise TCP latency measurement
sudo apt-get install -y hping3 mtr

# Measure TCP SYN latency to peer gRPC ports (more accurate than ICMP)
# From London to all other DCs
hping3 -S -p 7051 -c 100 dubai-peer0.silkroute.internal 2>&1 | tail -3
hping3 -S -p 7051 -c 100 singapore-peer0.silkroute.internal 2>&1 | tail -3
hping3 -S -p 7051 -c 100 tokyo-peer0.silkroute.internal 2>&1 | tail -3

# Full matrix measurement script
#!/bin/bash
# latency-matrix.sh, Measure RTT between all DC pairs
NODES=(
  "london-peer0.silkroute.internal"
  "dubai-peer0.silkroute.internal"
  "singapore-peer0.silkroute.internal"
  "tokyo-peer0.silkroute.internal"
)
LABELS=("LON" "DXB" "SIN" "TYO")
PORT=7051

echo "Source | Dest | Min(ms) | Avg(ms) | Max(ms) | StdDev(ms)"
echo "-------|------|---------|---------|---------|----------"
for i in "${!NODES[@]}"; do
  for j in "${!NODES[@]}"; do
    if [ "$i" != "$j" ]; then
      RESULT=$(hping3 -S -p $PORT -c 50 "${NODES[$j]}" 2>&1 | \
        grep "round-trip" | awk -F'[/ ]' '{print $4,$5,$6,$7}')
      echo "${LABELS[$i]} | ${LABELS[$j]} | $RESULT"
    fi
  done
done
SilkRoute Digital’s measured latency matrix shows the challenge of multi-region consensus. London to Dubai averages 65ms RTT. London to Singapore averages 170ms. London to Tokyo averages 210ms. Dubai to Singapore averages 90ms. These numbers define the upper bound for consensus round-trip times.
Free to use, share it in your presentations, blogs, or learning materials.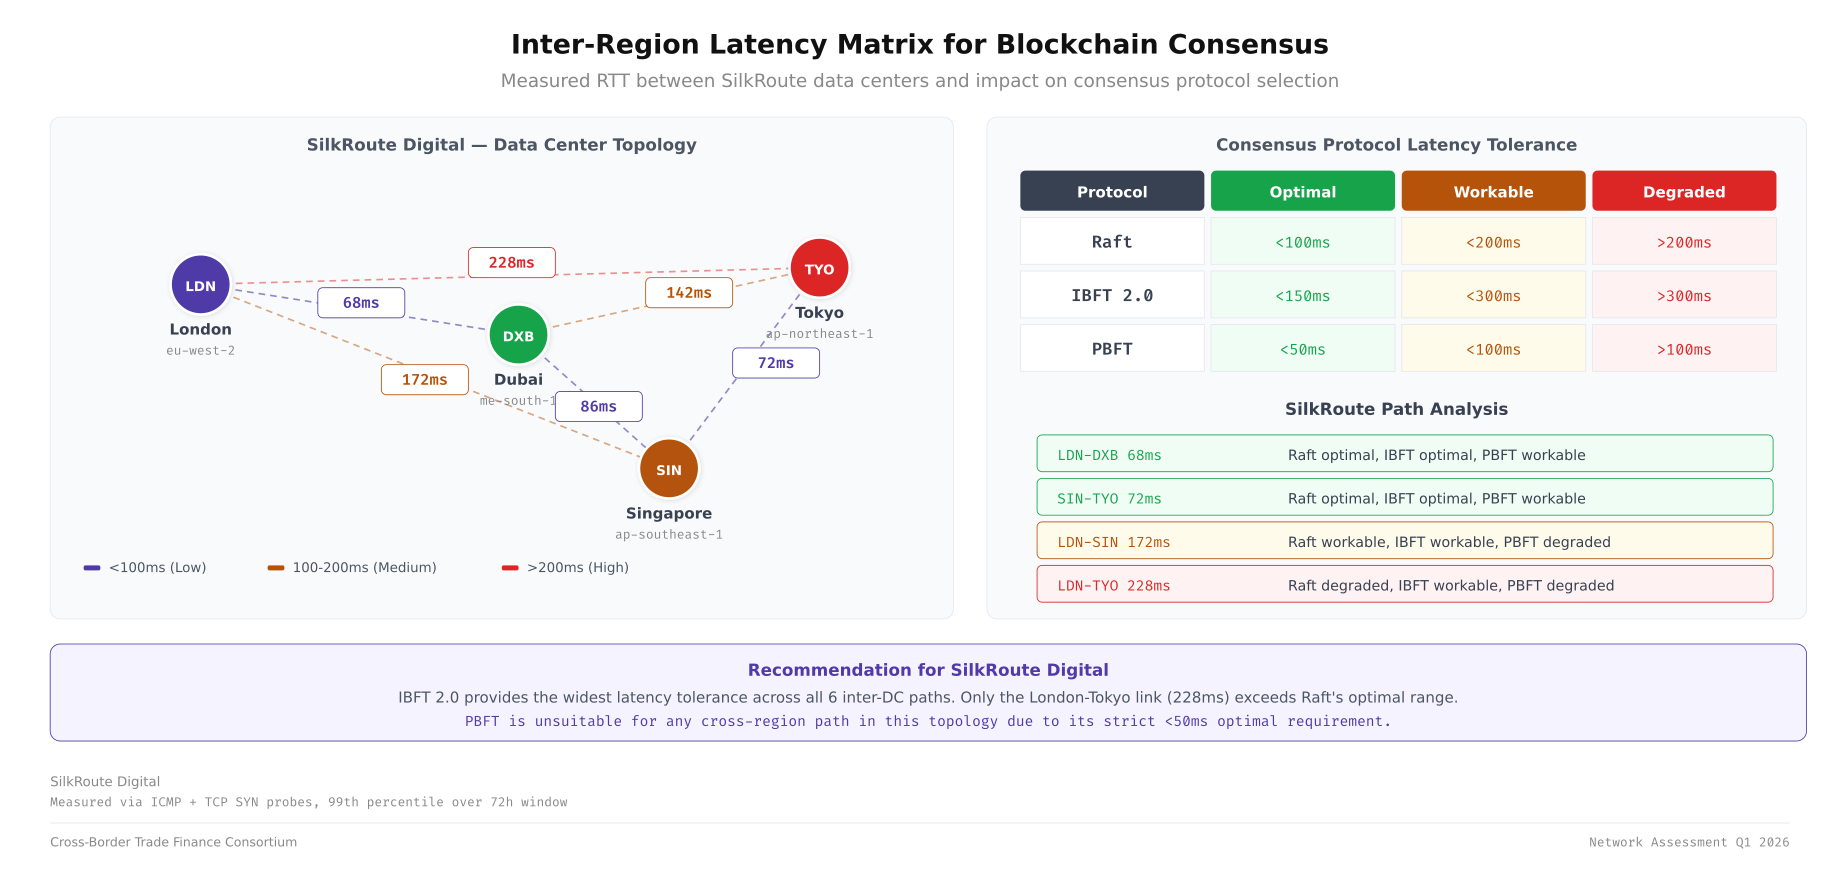
The above illustration maps out the measured round-trip latencies between all four SilkRoute Digital data centers. The latency values determine which consensus protocols can operate effectively across each DC pair, with Raft requiring sub-150ms RTT for reliable leader election and IBFT 2.0 tolerating up to 300ms before block production degrades.
# Continuous latency monitoring with Prometheus-compatible output
# Deploy as a sidecar container alongside each blockchain node

#!/bin/bash
# latency-exporter.sh, Export DC-pair latency as Prometheus metrics

TARGETS=(
  "london-orderer0.silkroute.internal:7050"
  "dubai-orderer1.silkroute.internal:7050"
  "singapore-orderer2.silkroute.internal:7050"
  "tokyo-peer0.silkroute.internal:7051"
)
LABELS=("london" "dubai" "singapore" "tokyo")
METRICS_PORT=9101
METRICS_FILE="/tmp/latency_metrics.prom"

while true; do
  echo "# HELP blockchain_node_rtt_ms RTT to peer node in milliseconds" > "$METRICS_FILE"
  echo "# TYPE blockchain_node_rtt_ms gauge" >> "$METRICS_FILE"

  for i in "${!TARGETS[@]}"; do
    HOST=$(echo "${TARGETS[$i]}" | cut -d: -f1)
    PORT=$(echo "${TARGETS[$i]}" | cut -d: -f2)

    RTT=$(hping3 -S -p "$PORT" -c 5 "$HOST" 2>&1 | \
      grep "round-trip" | awk -F'/' '{print $5}')

    if [ -n "$RTT" ]; then
      echo "blockchain_node_rtt_ms{target=\"${LABELS[$i]}\"} $RTT" >> "$METRICS_FILE"
    fi
  done

  # Serve metrics via node_exporter textfile collector
  cp "$METRICS_FILE" /var/lib/node_exporter/textfile_collector/latency.prom
  sleep 30
done
Raft Consensus Timing Under Network Latency
Raft consensus in Hyperledger Fabric relies on heartbeat intervals, election timeouts, and snapshot transfer timing that are all directly affected by network latency. The default Fabric Raft configuration uses a 500ms heartbeat tick with a 10-tick election timeout (5 seconds). These defaults work for single-datacenter deployments but require careful tuning for multi-region networks.
# Raft timing configuration in orderer.yaml
# Tune these based on your measured inter-DC latency

General:
  Cluster:
    # Base heartbeat interval, must be greater than max inter-DC RTT
    # SilkRoute: max RTT is London-Tokyo at 210ms
    # Set tick to 300ms (210ms RTT + 90ms buffer)
    HeartbeatTick: 300ms

    # Election timeout in ticks, leader considered dead after this many missed heartbeats
    # ElectionTick × HeartbeatTick = max time before new leader election
    # 10 × 300ms = 3 seconds (allows 10 missed heartbeats before election)
    ElectionTick: 10

    # Snapshot interval, how often Raft creates snapshots for lagging followers
    # Lower values help followers catch up faster across high-latency links
    SnapshotIntervalSize: 20 MB

Consensus:
  # Maximum block creation time, includes collecting transactions + ordering
  # Must account for cross-DC endorsement collection latency
  BatchTimeout: 2s

  # Maximum transactions per block
  BatchSize:
    MaxMessageCount: 100
    AbsoluteMaxBytes: 10 MB
    PreferredMaxBytes: 2 MB
The relationship between heartbeat interval, network latency, and election stability follows a clear formula. If the heartbeat interval is less than the maximum RTT between any two orderer nodes, the Raft cluster becomes unstable because followers interpret delayed heartbeats as leader failure. SilkRoute Digital sets the heartbeat to 300ms to accommodate the 210ms London to Tokyo path.
Free to use, share it in your presentations, blogs, or learning materials.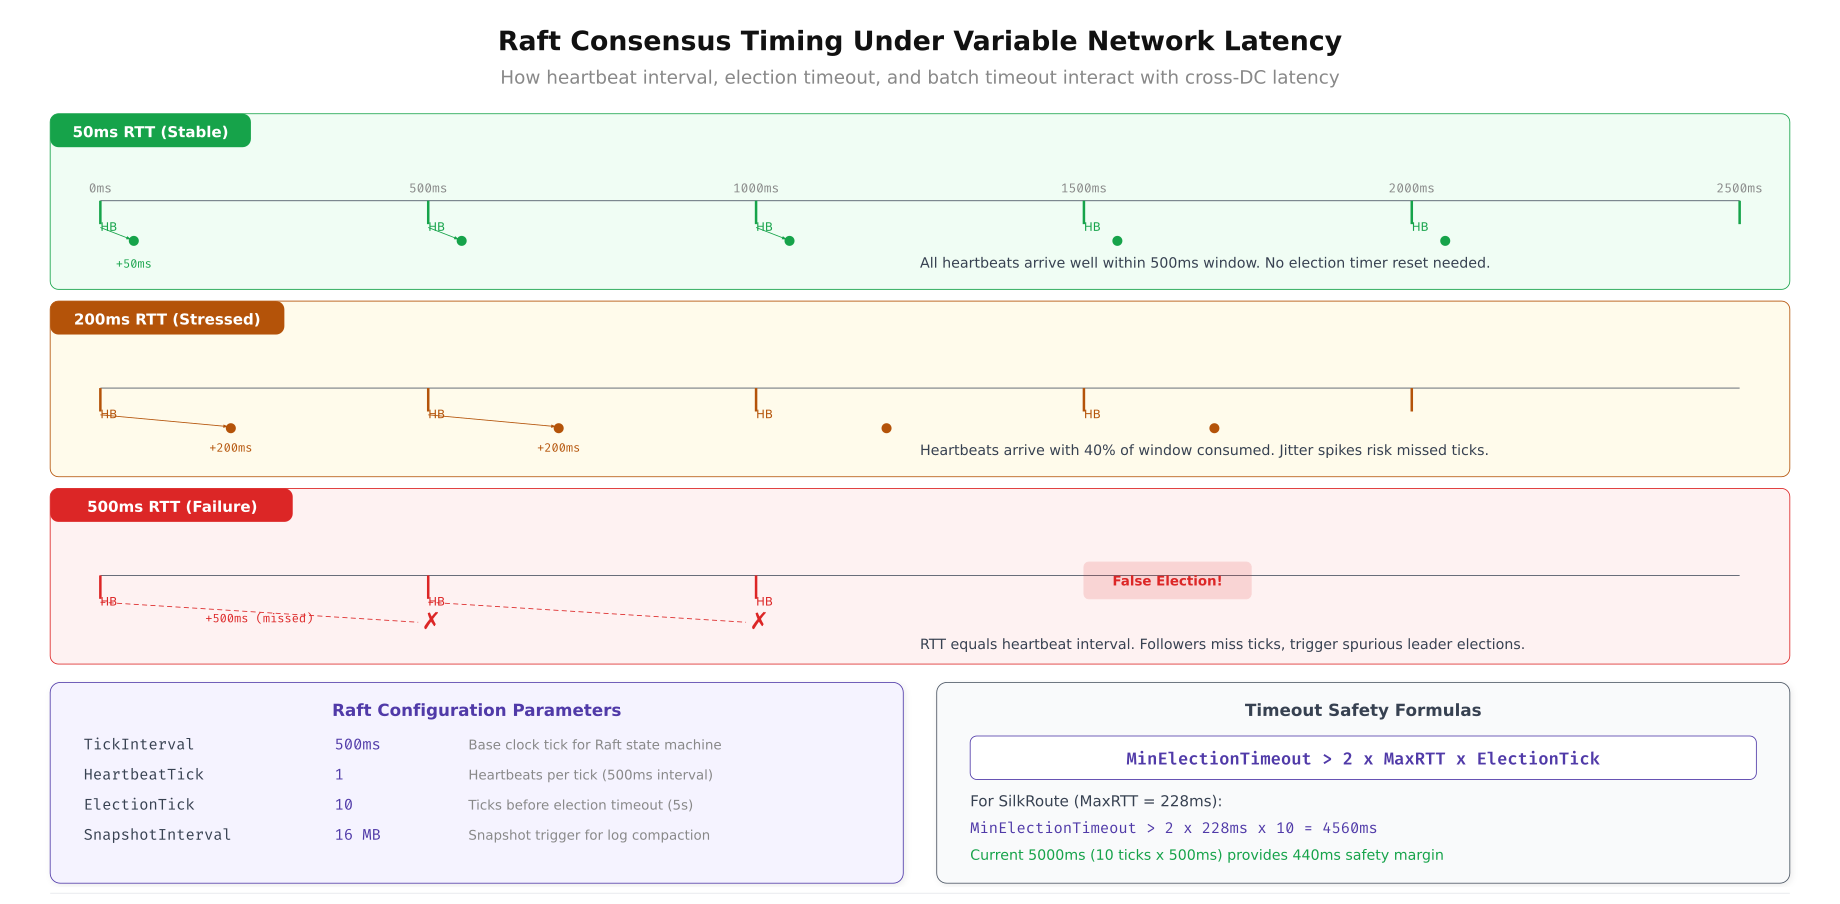
This diagram compares Raft behavior at three latency points. At 50ms RTT (single datacenter), default settings provide rapid leader election and high block throughput. At 200ms RTT (inter-region), the heartbeat tick must increase to avoid false elections, reducing block production rate. At 500ms RTT (intercontinental worst case), Raft requires aggressive timeout tuning and produces fewer blocks per second due to the consensus round-trip overhead.
# Validate Raft timing configuration against measured latency
# Run this before deploying orderers to a new region

#!/bin/bash
# raft-timing-validator.sh, Check if Raft config is safe for measured latency

HEARTBEAT_MS=300
ELECTION_TICKS=10
MAX_RTT_MS=210  # London-Tokyo measured worst case

ELECTION_TIMEOUT_MS=$((HEARTBEAT_MS * ELECTION_TICKS))

echo "=== Raft Timing Validation ==="
echo "Heartbeat interval:  ${HEARTBEAT_MS}ms"
echo "Election ticks:      ${ELECTION_TICKS}"
echo "Election timeout:    ${ELECTION_TIMEOUT_MS}ms"
echo "Max measured RTT:    ${MAX_RTT_MS}ms"
echo ""

# Rule 1: Heartbeat must be > max RTT
if [ "$HEARTBEAT_MS" -gt "$MAX_RTT_MS" ]; then
  echo "[PASS] Heartbeat (${HEARTBEAT_MS}ms) > Max RTT (${MAX_RTT_MS}ms)"
else
  echo "[FAIL] Heartbeat (${HEARTBEAT_MS}ms) <= Max RTT (${MAX_RTT_MS}ms)"
  echo "       Risk: False leader elections due to late heartbeats"
fi

# Rule 2: Election timeout should be >= 5x max RTT
SAFE_ELECTION=$((MAX_RTT_MS * 5))
if [ "$ELECTION_TIMEOUT_MS" -ge "$SAFE_ELECTION" ]; then
  echo "[PASS] Election timeout (${ELECTION_TIMEOUT_MS}ms) >= 5x RTT (${SAFE_ELECTION}ms)"
else
  echo "[WARN] Election timeout (${ELECTION_TIMEOUT_MS}ms) < 5x RTT (${SAFE_ELECTION}ms)"
  echo "       Risk: Premature elections during transient latency spikes"
fi

# Rule 3: Heartbeat should be >= 1.5x average RTT for stability margin
AVG_RTT_MS=134  # Average across all DC pairs
SAFE_HEARTBEAT=$(echo "$AVG_RTT_MS * 1.5" | bc | cut -d. -f1)
if [ "$HEARTBEAT_MS" -ge "$SAFE_HEARTBEAT" ]; then
  echo "[PASS] Heartbeat (${HEARTBEAT_MS}ms) >= 1.5x avg RTT (${SAFE_HEARTBEAT}ms)"
else
  echo "[WARN] Heartbeat (${HEARTBEAT_MS}ms) < 1.5x avg RTT (${SAFE_HEARTBEAT}ms)"
fi

echo ""
echo "Estimated max block rate: $(echo "1000 / ($HEARTBEAT_MS + $MAX_RTT_MS)" | bc -l | xargs printf '%.1f') blocks/sec"
echo "Estimated leader election time: ${ELECTION_TIMEOUT_MS}ms + ${MAX_RTT_MS}ms = $((ELECTION_TIMEOUT_MS + MAX_RTT_MS))ms"
TPS Degradation Curves Across Consensus Protocols
Transaction throughput (TPS) degrades differently for each consensus mechanism as latency increases. Raft, which requires leader-to-follower replication before committing, loses throughput roughly linearly with RTT. IBFT 2.0, which requires a three-phase commit (pre-prepare, prepare, commit), degrades faster because each phase adds a full round-trip. Understanding these curves helps you choose the right consensus for your latency profile.
# Benchmark TPS vs latency using Hyperledger Caliper
# Simulate varying latency using tc (traffic control) on each node

# Install traffic control dependencies
sudo apt-get install -y iproute2

# Add artificial latency to simulate different DC distances
# Run on each orderer/peer node before each benchmark round

# Test at 50ms RTT (simulate single-DC)
sudo tc qdisc add dev eth0 root netem delay 25ms 5ms distribution normal

# Run Caliper benchmark
npx caliper launch manager \
  --caliper-workspace /opt/caliper-workspace \
  --caliper-benchconfig benchmarks/latency-test.yaml \
  --caliper-networkconfig networks/silkroute-fabric.yaml \
  --caliper-flow-only-test

# Record TPS result
echo "50ms: $(grep 'Throughput' /opt/caliper-workspace/report.html | head -1)"

# Remove and set next latency level
sudo tc qdisc del dev eth0 root
sudo tc qdisc add dev eth0 root netem delay 100ms 10ms distribution normal

# Repeat Caliper benchmark for 200ms, 300ms, 400ms, 500ms
# Full automation script below

#!/bin/bash
# tps-latency-benchmark.sh, Measure TPS at varying latency levels

LATENCIES=(25 50 100 150 200 250)  # One-way delay in ms (RTT = 2x)
RESULTS_FILE="tps_latency_results.csv"

echo "rtt_ms,tps_avg,tps_p99_latency_ms,block_time_ms" > "$RESULTS_FILE"

for DELAY in "${LATENCIES[@]}"; do
  RTT=$((DELAY * 2))
  echo "Testing at ${RTT}ms RTT (${DELAY}ms one-way delay)..."

  # Set latency on all interfaces
  sudo tc qdisc replace dev eth0 root netem delay ${DELAY}ms 5ms distribution normal

  # Wait for Raft to stabilize with new latency
  sleep 10

  # Run Caliper benchmark (60-second test duration)
  npx caliper launch manager \
    --caliper-workspace /opt/caliper-workspace \
    --caliper-benchconfig benchmarks/latency-test.yaml \
    --caliper-networkconfig networks/silkroute-fabric.yaml \
    --caliper-flow-only-test 2>/dev/null

  # Extract metrics from Caliper report
  TPS=$(jq '.summary.throughput.avg' /opt/caliper-workspace/report.json)
  P99=$(jq '.summary.latency.p99' /opt/caliper-workspace/report.json)
  BLOCK=$(jq '.summary.blockTime.avg' /opt/caliper-workspace/report.json)

  echo "${RTT},${TPS},${P99},${BLOCK}" >> "$RESULTS_FILE"

  # Clean up for next round
  sudo tc qdisc del dev eth0 root
  sleep 5
done

echo "Results saved to $RESULTS_FILE"
cat "$RESULTS_FILE" | column -t -s,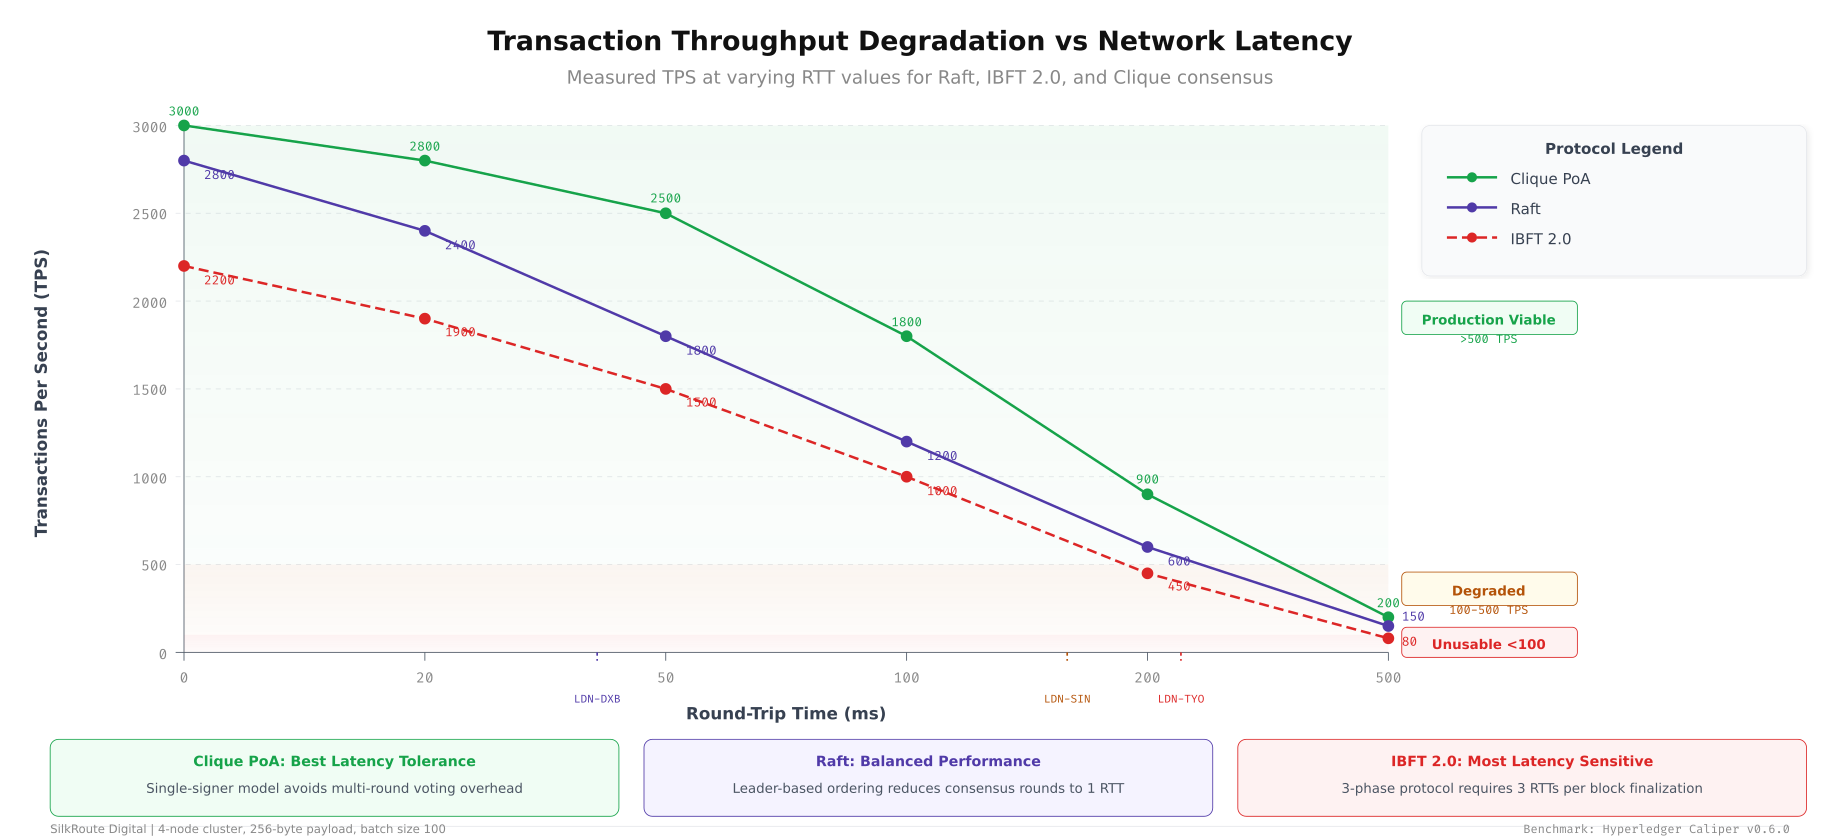
As shown above, Raft maintains approximately 800 TPS at 50ms RTT but drops to 200 TPS at 300ms RTT. IBFT 2.0 starts higher at around 600 TPS (due to parallel block proposal) but degrades faster, reaching 100 TPS at 300ms RTT because each consensus round involves three message phases. Clique (proof-of-authority) shows the least degradation since it only requires a single signer, but it sacrifices Byzantine fault tolerance for that latency resilience.
Gossip Protocol Propagation Across Regions
Hyperledger Fabric's Gossip protocol distributes blocks, state data, and membership information across peers. In a multi-region deployment, Gossip propagation time determines how quickly all peers reach the same ledger height. Slow propagation creates temporary inconsistencies where some peers serve stale data to client applications.
# Gossip protocol tuning in core.yaml for multi-region peers
# Each parameter directly affects cross-DC propagation speed

peer:
  gossip:
    # Bootstrap peers, include at least one peer per DC for cross-region seeding
    bootstrap: >
      london-peer0.silkroute.internal:7051,
      dubai-peer0.silkroute.internal:7051,
      singapore-peer0.silkroute.internal:7051,
      tokyo-peer0.silkroute.internal:7051

    # How often to push state to neighbors (lower = faster propagation, more bandwidth)
    # Default 4s, reduce to 1s for faster cross-DC sync
    publishStateInfoInterval: 1s

    # How often to pull state from neighbors
    # Complements push, pull catches anything push missed
    requestStateInfoInterval: 2s

    # Number of peers to push each message to per round
    # Higher fanout = faster propagation but more bandwidth
    # With 4 DCs × 3 peers = 12 total peers, fanout of 4 ensures each DC gets messages quickly
    pushPullFanout: 4

    # Maximum time to wait for block delivery from ordering service
    # before requesting from peers via Gossip
    # Set slightly above orderer-to-peer max RTT (London orderer to Tokyo peer: 210ms + buffer)
    deliveryWaitTime: 500ms

    # Peer reconnection settings for unstable cross-DC links
    reconnectInterval: 5s
    maxConnectionAttempts: 120

    # Election settings for leader peer (delivers blocks from orderer)
    useLeaderElection: true
    orgLeader: false
    election:
      # Leader election timeout, must account for cross-DC latency
      leaderElectionDuration: 15s
      # How often leader sends alive messages
      leaderAliveThreshold: 10s

    # State transfer settings for catching up lagging peers
    state:
      enabled: true
      # Number of blocks to request per batch from peers
      batchSize: 10
      # Max number of parallel state transfer requests
      maxRetries: 3
      # Time between state transfer check cycles
      checkInterval: 10s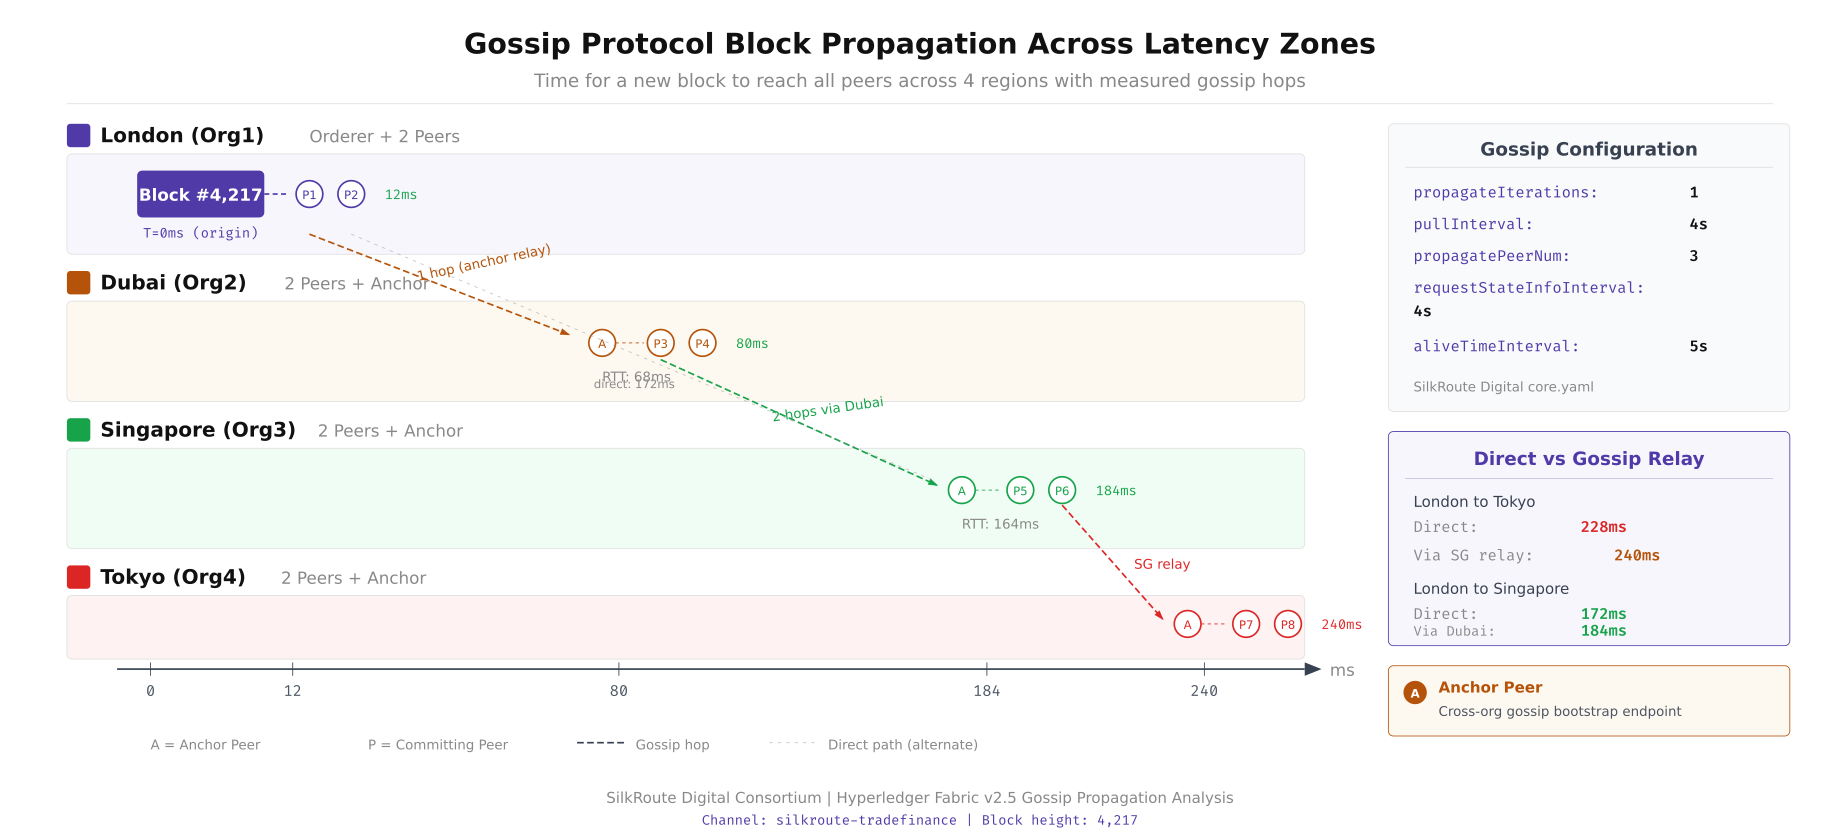
This diagram traces how a newly committed block propagates from the ordering service through Gossip to all peer nodes across four regions. London peers receive the block first (direct delivery from the local orderer), then push to Dubai (65ms), which forwards to Singapore (90ms from Dubai). Tokyo receives via both Singapore (70ms) and direct London propagation (210ms). The total propagation time from commit to all peers synchronized is approximately 280ms with optimized Gossip settings.
# Monitor Gossip propagation delay between peers
# Compare ledger heights across all peers to detect sync lag

#!/bin/bash
# gossip-sync-monitor.sh, Detect cross-DC Gossip propagation delays

PEERS=(
  "london-peer0.silkroute.internal:7051"
  "london-peer1.silkroute.internal:7051"
  "dubai-peer0.silkroute.internal:7051"
  "dubai-peer1.silkroute.internal:7051"
  "singapore-peer0.silkroute.internal:7051"
  "singapore-peer1.silkroute.internal:7051"
  "tokyo-peer0.silkroute.internal:7051"
  "tokyo-peer1.silkroute.internal:7051"
)
CHANNEL="silkroute-trade"
MSPCONFIG="/opt/fabric/msp"

echo "=== Gossip Sync Status, $(date -Iseconds) ==="
echo "Peer | Height | Lag"

MAX_HEIGHT=0
declare -A HEIGHTS

for PEER in "${PEERS[@]}"; do
  HEIGHT=$(peer channel getinfo \
    -c "$CHANNEL" \
    --peerAddresses "$PEER" \
    --tlsRootCertFiles /opt/fabric/tls/ca.crt \
    2>/dev/null | grep -oP 'height:\K[0-9]+')

  HEIGHTS["$PEER"]=$HEIGHT
  if [ "$HEIGHT" -gt "$MAX_HEIGHT" ]; then
    MAX_HEIGHT=$HEIGHT
  fi
done

for PEER in "${PEERS[@]}"; do
  HEIGHT=${HEIGHTS["$PEER"]}
  LAG=$((MAX_HEIGHT - HEIGHT))

  if [ "$LAG" -gt 5 ]; then
    STATUS="[CRITICAL] ${LAG} blocks behind"
  elif [ "$LAG" -gt 0 ]; then
    STATUS="[WARNING] ${LAG} blocks behind"
  else
    STATUS="[OK]"
  fi

  SHORT_NAME=$(echo "$PEER" | cut -d. -f1)
  echo "${SHORT_NAME} | ${HEIGHT} | ${STATUS}"
done

echo ""
echo "Max height: ${MAX_HEIGHT} | Timestamp: $(date +%s)"
Endorsement Policy Latency Analysis
Endorsement policies define which peers must sign a transaction proposal before it can be submitted for ordering. The policy type directly impacts transaction latency in multi-region deployments. An AND policy requiring all organizations to endorse waits for the slowest peer. An OR policy requiring any single organization completes as fast as the nearest peer. The OutOf(N, M) policy provides a middle ground by allowing a subset of organizations to endorse.
# Endorsement policy definitions and their latency implications
# chaincode lifecycle approve, set policy during chaincode approval

# Policy 1: AND, All four organizations must endorse
# Latency = max(RTT to each org's peer) = 210ms (London to Tokyo)
peer lifecycle chaincode approveformyorg \
  --channelID silkroute-trade \
  --name trade-contract \
  --version 1.0 \
  --signature-policy "AND('LondonMSP.peer','DubaiMSP.peer','SingaporeMSP.peer','TokyoMSP.peer')" \
  --sequence 1 \
  --tls --cafile /opt/fabric/tls/orderer-ca.crt

# Policy 2: OR, Any one organization can endorse
# Latency = min(RTT to each org's peer) = 2ms (local DC peer)
peer lifecycle chaincode approveformyorg \
  --channelID silkroute-trade \
  --name trade-contract \
  --version 1.0 \
  --signature-policy "OR('LondonMSP.peer','DubaiMSP.peer','SingaporeMSP.peer','TokyoMSP.peer')" \
  --sequence 1 \
  --tls --cafile /opt/fabric/tls/orderer-ca.crt

# Policy 3: OutOf(3,4), Any 3 of 4 organizations must endorse
# Latency = third-fastest RTT = 170ms (skip Tokyo if calling from London)
peer lifecycle chaincode approveformyorg \
  --channelID silkroute-trade \
  --name trade-contract \
  --version 1.0 \
  --signature-policy "OutOf(3,'LondonMSP.peer','DubaiMSP.peer','SingaporeMSP.peer','TokyoMSP.peer')" \
  --sequence 1 \
  --tls --cafile /opt/fabric/tls/orderer-ca.crt

# Measure endorsement latency for each policy type
#!/bin/bash
# endorsement-latency-test.sh, Compare policy latency impact

CHANNEL="silkroute-trade"
CHAINCODE="trade-contract"
ITERATIONS=100

echo "=== Endorsement Latency Test ==="
echo "Testing $ITERATIONS transactions per policy type"
echo ""

# Test AND policy (all 4 orgs)
TOTAL=0
for i in $(seq 1 $ITERATIONS); do
  START=$(date +%s%N)
  peer chaincode invoke \
    -C "$CHANNEL" -n "$CHAINCODE" \
    --peerAddresses london-peer0.silkroute.internal:7051 \
    --peerAddresses dubai-peer0.silkroute.internal:7051 \
    --peerAddresses singapore-peer0.silkroute.internal:7051 \
    --peerAddresses tokyo-peer0.silkroute.internal:7051 \
    --tlsRootCertFiles /opt/fabric/tls/london-ca.crt \
    --tlsRootCertFiles /opt/fabric/tls/dubai-ca.crt \
    --tlsRootCertFiles /opt/fabric/tls/singapore-ca.crt \
    --tlsRootCertFiles /opt/fabric/tls/tokyo-ca.crt \
    -c '{"function":"CreateTrade","Args":["TRADE-'$i'","wheat","1000"]}' \
    --waitForEvent 2>/dev/null
  END=$(date +%s%N)
  TOTAL=$((TOTAL + (END - START) / 1000000))
done
echo "AND policy avg: $((TOTAL / ITERATIONS))ms"

# Test OutOf(3,4), skip the farthest peer dynamically
TOTAL=0
for i in $(seq 1 $ITERATIONS); do
  START=$(date +%s%N)
  peer chaincode invoke \
    -C "$CHANNEL" -n "$CHAINCODE" \
    --peerAddresses london-peer0.silkroute.internal:7051 \
    --peerAddresses dubai-peer0.silkroute.internal:7051 \
    --peerAddresses singapore-peer0.silkroute.internal:7051 \
    --tlsRootCertFiles /opt/fabric/tls/london-ca.crt \
    --tlsRootCertFiles /opt/fabric/tls/dubai-ca.crt \
    --tlsRootCertFiles /opt/fabric/tls/singapore-ca.crt \
    -c '{"function":"CreateTrade","Args":["TRADE-'$i'","rice","500"]}' \
    --waitForEvent 2>/dev/null
  END=$(date +%s%N)
  TOTAL=$((TOTAL + (END - START) / 1000000))
done
echo "OutOf(3,4) avg: $((TOTAL / ITERATIONS))ms"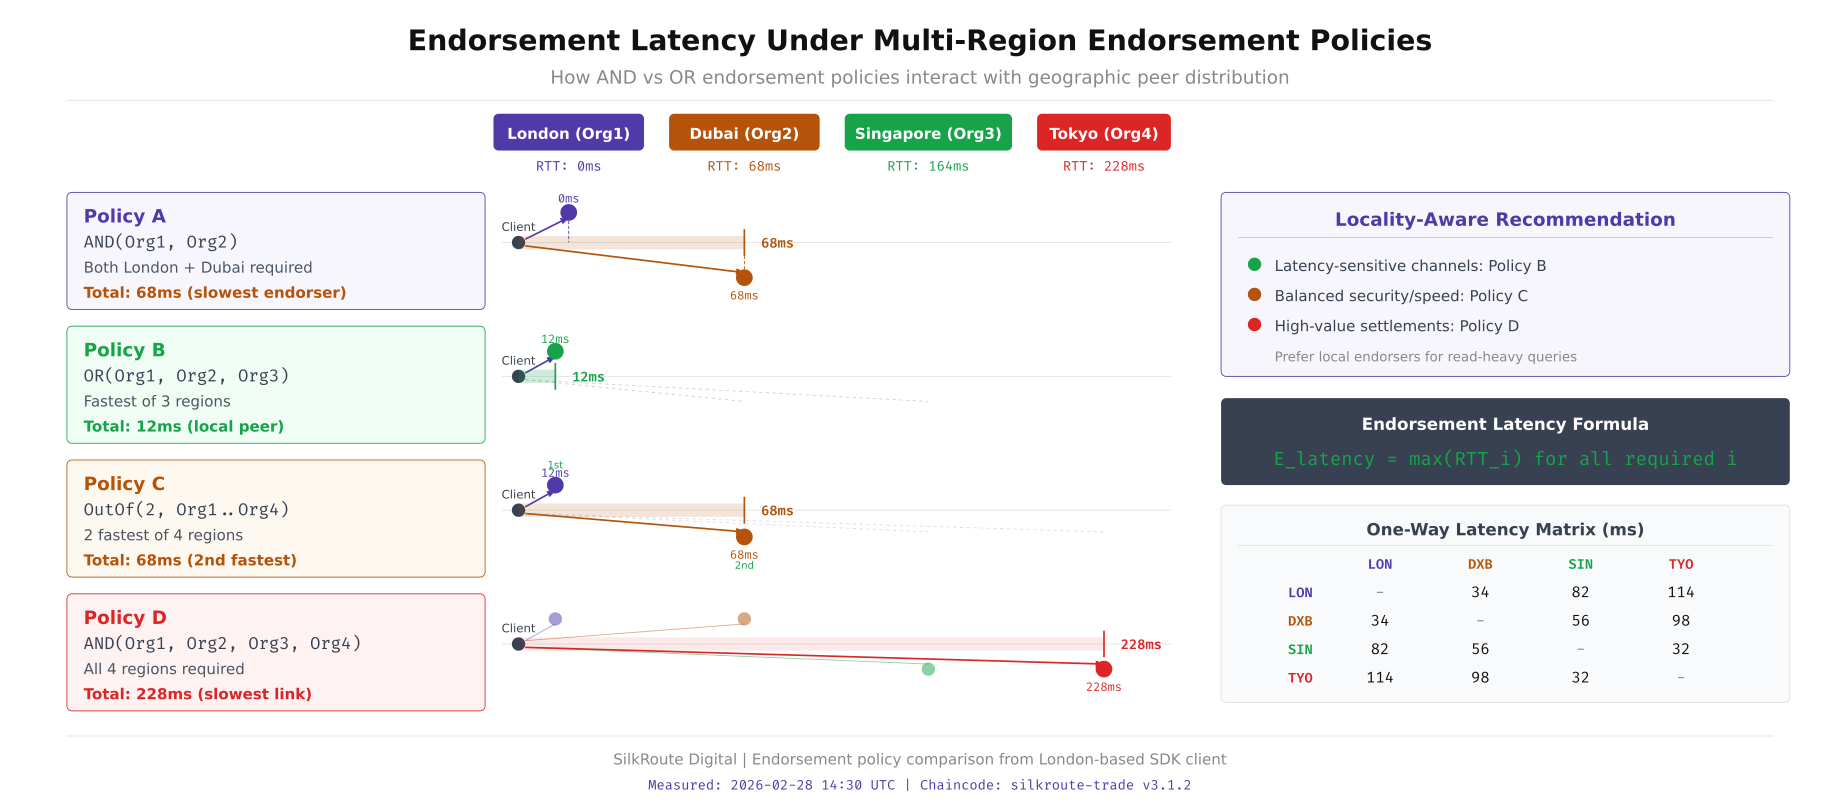
This visualization breaks down the endorsement timing for each policy type from a London-based client. The AND policy must wait for Tokyo's 210ms response, making every transaction at least 210ms for endorsement alone. The OutOf(3,4) policy can skip the slowest responder, bringing endorsement latency down to approximately 170ms (Singapore being the third-fastest). The OR policy completes in under 5ms using the local London peer, though it provides no multi-organization validation.
Latency Optimization Techniques
Reducing the impact of network latency on blockchain consensus involves three categories of optimizations: protocol tuning (adjusting consensus parameters), network path optimization (reducing physical RTT), and architectural patterns (designing around latency constraints).
# Protocol Tuning, TCP stack optimization for blockchain traffic
# Apply on every blockchain node (orderers + peers)

# /etc/sysctl.d/99-blockchain-latency.conf
# Enable BBR congestion control, better throughput on high-latency paths
net.core.default_qdisc = fqcodel
net.ipv4.tcp_congestion_control = bbr

# Increase TCP window sizes for high-bandwidth high-latency links
# BDP = Bandwidth × Delay = 10Gbps × 0.210s = 262MB theoretical max
net.core.rmem_max = 67108864
net.core.wmem_max = 67108864
net.ipv4.tcp_rmem = 4096 1048576 67108864
net.ipv4.tcp_wmem = 4096 1048576 67108864

# Enable TCP window scaling for large transfers (Raft snapshots)
net.ipv4.tcp_window_scaling = 1

# Reduce TIME_WAIT for faster connection recycling (many gRPC connections)
net.ipv4.tcp_fin_timeout = 15

# Enable TCP keepalive tuning, detect dead connections faster
net.ipv4.tcp_keepalive_time = 30
net.ipv4.tcp_keepalive_intvl = 10
net.ipv4.tcp_keepalive_probes = 3

# Enable TCP Fast Open, save one RTT on connection establishment
net.ipv4.tcp_fastopen = 3

# Apply changes
sudo sysctl --system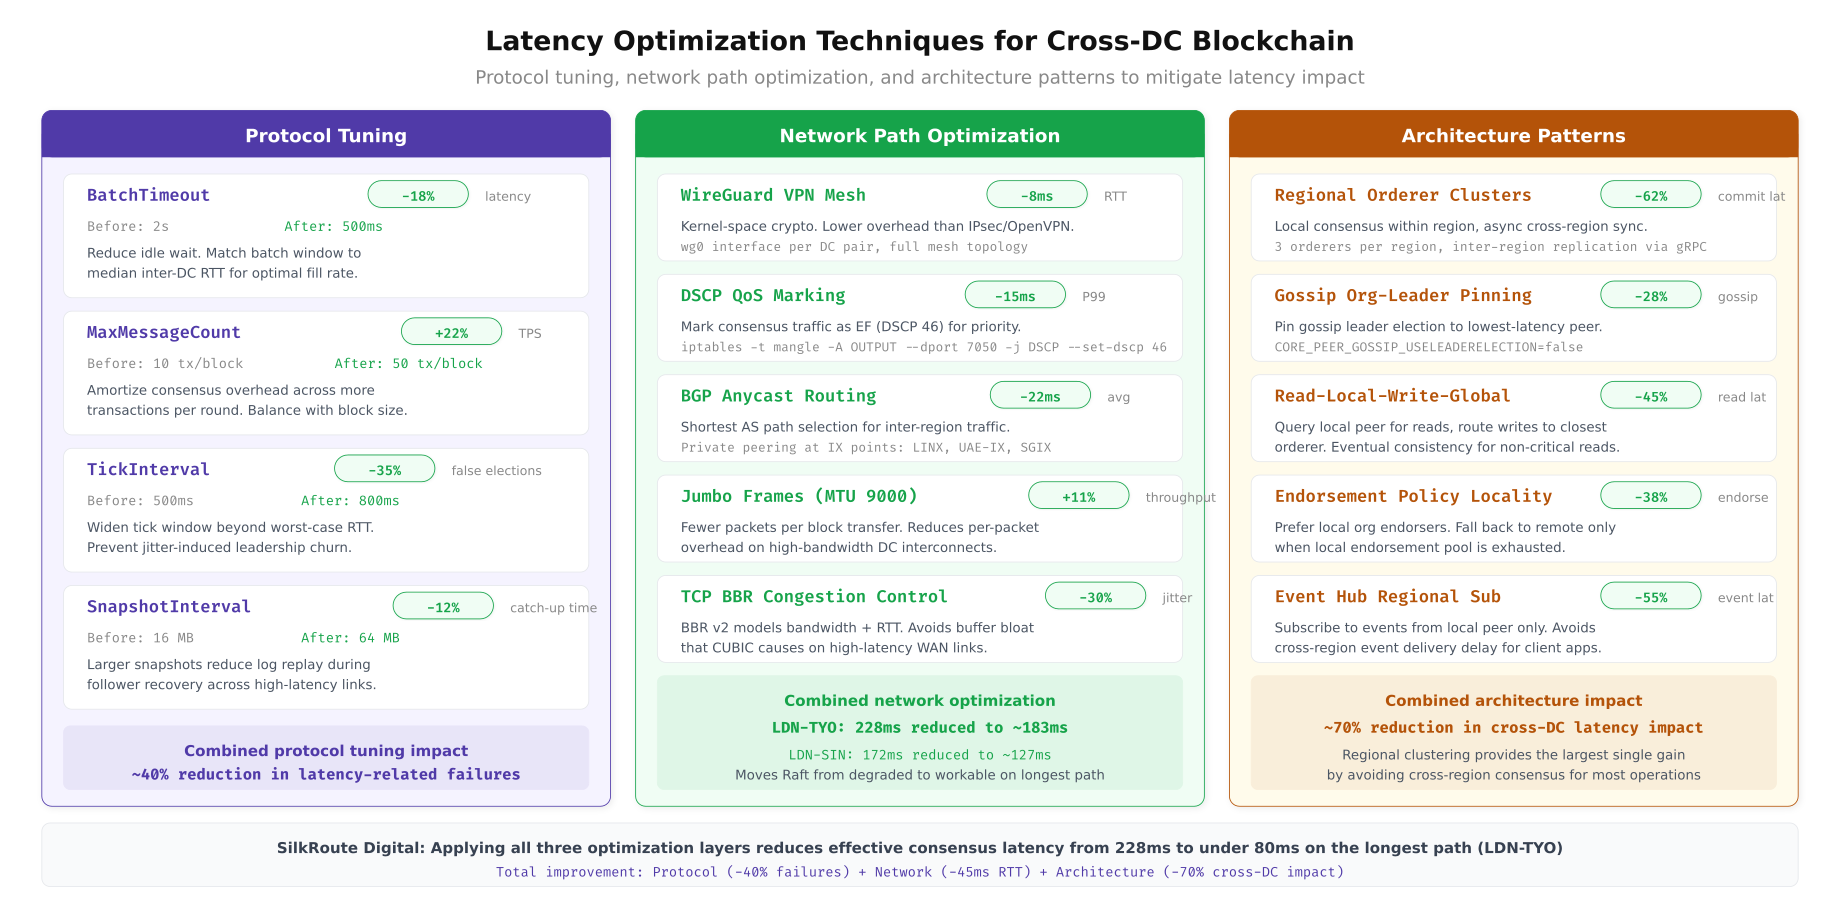
The above illustration organizes the latency mitigation strategies into three pillars. Protocol tuning delivers 15 to 30 percent improvement through TCP BBR, gRPC keepalive settings, and HTTP/2 multiplexing. Network path optimization (dedicated circuits, peering exchanges, SD-WAN) can cut physical RTT by 20 to 40 percent. Architectural patterns such as regional ordering, anchor peer placement, and query peer separation provide the largest gains by eliminating cross-region round-trips from the critical path.
# gRPC keepalive configuration for Fabric peer and orderer connections
# Prevents connection drops on high-latency, idle-prone cross-DC links

# In core.yaml (peer configuration)
peer:
  keepalive:
    # Client-side keepalive settings
    client:
      # How often to send keepalive pings when connection is idle
      interval: 30s
      # How long to wait for keepalive response before considering dead
      timeout: 20s
    # Server-side keepalive enforcement
    deliveryClient:
      interval: 30s
      timeout: 20s

# In orderer.yaml (orderer configuration)
General:
  Keepalive:
    # Server-side keepalive parameters
    ServerMinInterval: 30s
    ServerInterval: 60s
    ServerTimeout: 20s

# HAProxy configuration for latency-aware load balancing
# Route endorsement requests to lowest-latency peer per organization

# /etc/haproxy/haproxy.cfg
frontend fabric_gateway
    bind *:7051 ssl crt /etc/haproxy/certs/silkroute.pem
    default_backend fabric_peers_london

backend fabric_peers_london
    # Use leastconn for even distribution
    balance leastconn
    # Health check every 5 seconds
    option httpchk GET /healthz

    # Priority ordering, local DC peers first, then nearby DCs
    server london-peer0 london-peer0.silkroute.internal:7051 check weight 100
    server london-peer1 london-peer1.silkroute.internal:7051 check weight 100
    # Backup peers from nearest DC (Dubai = 65ms)
    server dubai-peer0 dubai-peer0.silkroute.internal:7051 check weight 50 backup
    server dubai-peer1 dubai-peer1.silkroute.internal:7051 check weight 50 backup

backend fabric_peers_endorsement
    # For endorsement, send to all required orgs simultaneously
    balance roundrobin
    # Set timeout to account for cross-DC latency
    timeout server 5s
    timeout connect 2s

    server london-peer0 london-peer0.silkroute.internal:7051 check
    server dubai-peer0 dubai-peer0.silkroute.internal:7051 check
    server singapore-peer0 singapore-peer0.silkroute.internal:7051 check
    server tokyo-peer0 tokyo-peer0.silkroute.internal:7051 check
# Regional ordering service configuration
# Deploy orderers in a latency-aware topology
# SilkRoute Digital uses 5 orderers across 4 DCs for Raft consensus
# Placement strategy: 2 orderers in the primary DC (London), 1 per satellite DC
# This ensures the Raft leader is typically in London (closest to majority)
# orderer-topology.yaml, Kubernetes deployment
apiVersion: apps/v1
kind: StatefulSet
metadata:
name: orderer0-london
namespace: silkroute-orderers
spec:
replicas: 1
template:
metadata:
labels:
app: orderer
dc: london
role: raft-preferred-leader
spec:
nodeSelector:
topology.kubernetes.io/zone: eu-west-2a
affinity:
podAntiAffinity:
requiredDuringSchedulingIgnoredDuringExecution:
- labelSelector:
matchExpressions:
- key: app
operator: In
values: ["orderer"]
topologyKey: kubernetes.io/hostname
containers:
- name: orderer
image: hyperledger/fabric-orderer:2.5.4
env:
- name: ORDERER_GENERAL_CLUSTER_SENDBUFFERSIZE
# Increase send buffer for high-latency links
value: "100"
ports:
- containerPort: 7050
- containerPort: 7053
resources:
requests:
cpu: "2"
memory: "4Gi"
limits:
cpu: "4"
memory: "8Gi"
---
# Satellite DC orderer, Singapore
apiVersion: apps/v1
kind: StatefulSet
metadata:
name: orderer2-singapore
namespace: silkroute-orderers
spec:
replicas: 1
template:
metadata:
labels:
app: orderer
dc: singapore
spec:
nodeSelector:
topology.kubernetes.io/zone: ap-southeast-1a
containers:
- name: orderer
image: hyperledger/fabric-orderer:2.5.4
env:
- name: ORDERER_GENERAL_CLUSTER_SENDBUFFERSIZE
value: "100"
# Higher snapshot interval for satellite orderers
# Reduces bandwidth usage on expensive cross-DC links
- name: ORDERER_CONSENSUS_SNAPINTERVALSIZE
value: "50MB"Besu IBFT 2.0 Latency Tuning
Hyperledger Besu with IBFT 2.0 consensus uses a four-phase protocol (pre-prepare, prepare, commit, round change) where each phase requires messages to traverse the network. The block period and request timeout parameters must account for the worst-case round-trip between any two validators. SilkRoute Digital runs a 4-validator Besu sidechain for settlement finality.
# Besu IBFT 2.0 genesis configuration with latency-optimized parameters
# genesis.json, Configure block timing based on measured inter-validator latency

{
  "config": {
    "chainId": 2026,
    "ibft2": {
      "blockperiodseconds": 2,
      "epochlength": 30000,
      "requesttimeoutseconds": 8,
      "messageQueueLimit": 1000,
      "duplicateMessageLimit": 100,
      "futureMessagesLimit": 1000,
      "futureMessagesMaxDistance": 10
    }
  },
  "nonce": "0x0",
  "timestamp": "0x0",
  "gasLimit": "0x1fffffffffffff",
  "difficulty": "0x1",
  "mixHash": "0x63746963616c2062797a616e74696e65206661756c7420746f6c6572616e6365",
  "coinbase": "0x0000000000000000000000000000000000000000",
  "alloc": {},
  "extraData": "0x..."
}

# blockperiodseconds: 2
#   At 210ms max RTT, IBFT needs ~840ms for one consensus round (4 phases × 210ms)
#   Setting block period to 2s provides 1160ms buffer for network jitter
#   Lower values (1s) cause frequent round changes under transient latency spikes

# requesttimeoutseconds: 8
#   How long to wait before triggering a round change
#   Must be > blockperiodseconds × number of validator failures to tolerate
#   8s allows up to 3 missed rounds before round change
#   Formula: timeout > blockPeriod × (2f + 1) where f = tolerated failures
# Besu node startup with latency-optimized networking
# Run on each validator node
/opt/besu/bin/besu \
--data-path=/var/besu/data \
--genesis-file=/opt/besu/config/genesis.json \
--node-private-key-file=/opt/besu/config/key \
--rpc-http-enabled \
--rpc-http-api=ETH,NET,IBFT,ADMIN \
--rpc-http-port=8545 \
--p2p-host=0.0.0.0 \
--p2p-port=30303 \
--min-gas-price=0 \
--host-allowlist="*" \
--rpc-http-cors-origins="*" \
# Networking optimizations for high-latency
--Xp2p-peer-lower-bound=4 \
--Xp2p-peer-upper-bound=8 \
# Increase message buffer for delayed cross-DC messages
--Xibft-message-queue-limit=1000 \
--Xibft-future-messages-limit=1000 \
--Xibft-future-messages-max-distance=10 \
# Enable native crypto for faster signature verification
--Xsecp256k1-native-enabled=true
# Verify IBFT consensus health after deployment
curl -s -X POST http://localhost:8545 \
-H "Content-Type: application/json" \
-d '{"jsonrpc":"2.0","method":"ibft_getValidatorsByBlockNumber","params":["latest"],"id":1}' | jq
# Check round change frequency, high count indicates latency issues
curl -s -X POST http://localhost:8545 \
-H "Content-Type: application/json" \
-d '{"jsonrpc":"2.0","method":"ibft_getSignerMetrics","params":["0x0","latest"],"id":1}' | jq '.result[] | {address, proposedBlockCount, lastProposedBlockNumber}'Building a Latency Monitoring Dashboard
Continuous monitoring of inter-node latency, consensus timing, and block propagation speed is essential for maintaining blockchain network health. SilkRoute Digital deploys a Prometheus and Grafana stack that tracks six critical metrics: node-to-node RTT, Raft leader election frequency, block commit latency, Gossip propagation delay, endorsement response time, and consensus round duration.
# Prometheus alerting rules for latency-related blockchain issues
# /etc/prometheus/rules/blockchain-latency.yml

groups:
  - name: blockchain_latency_alerts
    interval: 15s
    rules:
      # Alert when inter-node RTT exceeds safe threshold
      - alert: HighNodeLatency
        expr: blockchain_node_rtt_ms > 250
        for: 2m
        labels:
          severity: warning
        annotations:
          summary: "High latency to {{ $labels.target }}"
          description: "RTT to {{ $labels.target }} is {{ $value }}ms (threshold: 250ms)"

      # Alert on Raft leader elections, frequent elections indicate latency issues
      - alert: FrequentRaftElections
        expr: increase(fabric_consensus_etcdraft_leader_changes[10m]) > 2
        labels:
          severity: critical
        annotations:
          summary: "Frequent Raft leader elections detected"
          description: "{{ $value }} leader changes in 10 minutes"

      # Alert when block commit latency exceeds threshold
      - alert: HighBlockCommitLatency
        expr: histogram_quantile(0.99, rate(fabric_ledger_block_processing_time_bucket[5m])) > 2
        for: 5m
        labels:
          severity: warning
        annotations:
          summary: "Block commit latency P99 exceeds 2 seconds"

      # Alert when endorsement latency spikes
      - alert: HighEndorsementLatency
        expr: histogram_quantile(0.95, rate(fabric_endorser_proposal_duration_bucket[5m])) > 1
        for: 5m
        labels:
          severity: warning
        annotations:
          summary: "Endorsement P95 latency exceeds 1 second"

      # Alert when Gossip peer count drops (connectivity issue)
      - alert: LowGossipPeerCount
        expr: fabric_gossip_membership_total_peers_known < 6
        for: 3m
        labels:
          severity: critical
        annotations:
          summary: "Gossip sees only {{ $value }} peers (expected 8+)"

      # Besu IBFT round change alert
      - alert: FrequentIBFTRoundChanges
        expr: increase(besu_ibft_round_change_total[10m]) > 5
        labels:
          severity: warning
        annotations:
          summary: "{{ $value }} IBFT round changes in 10 minutes"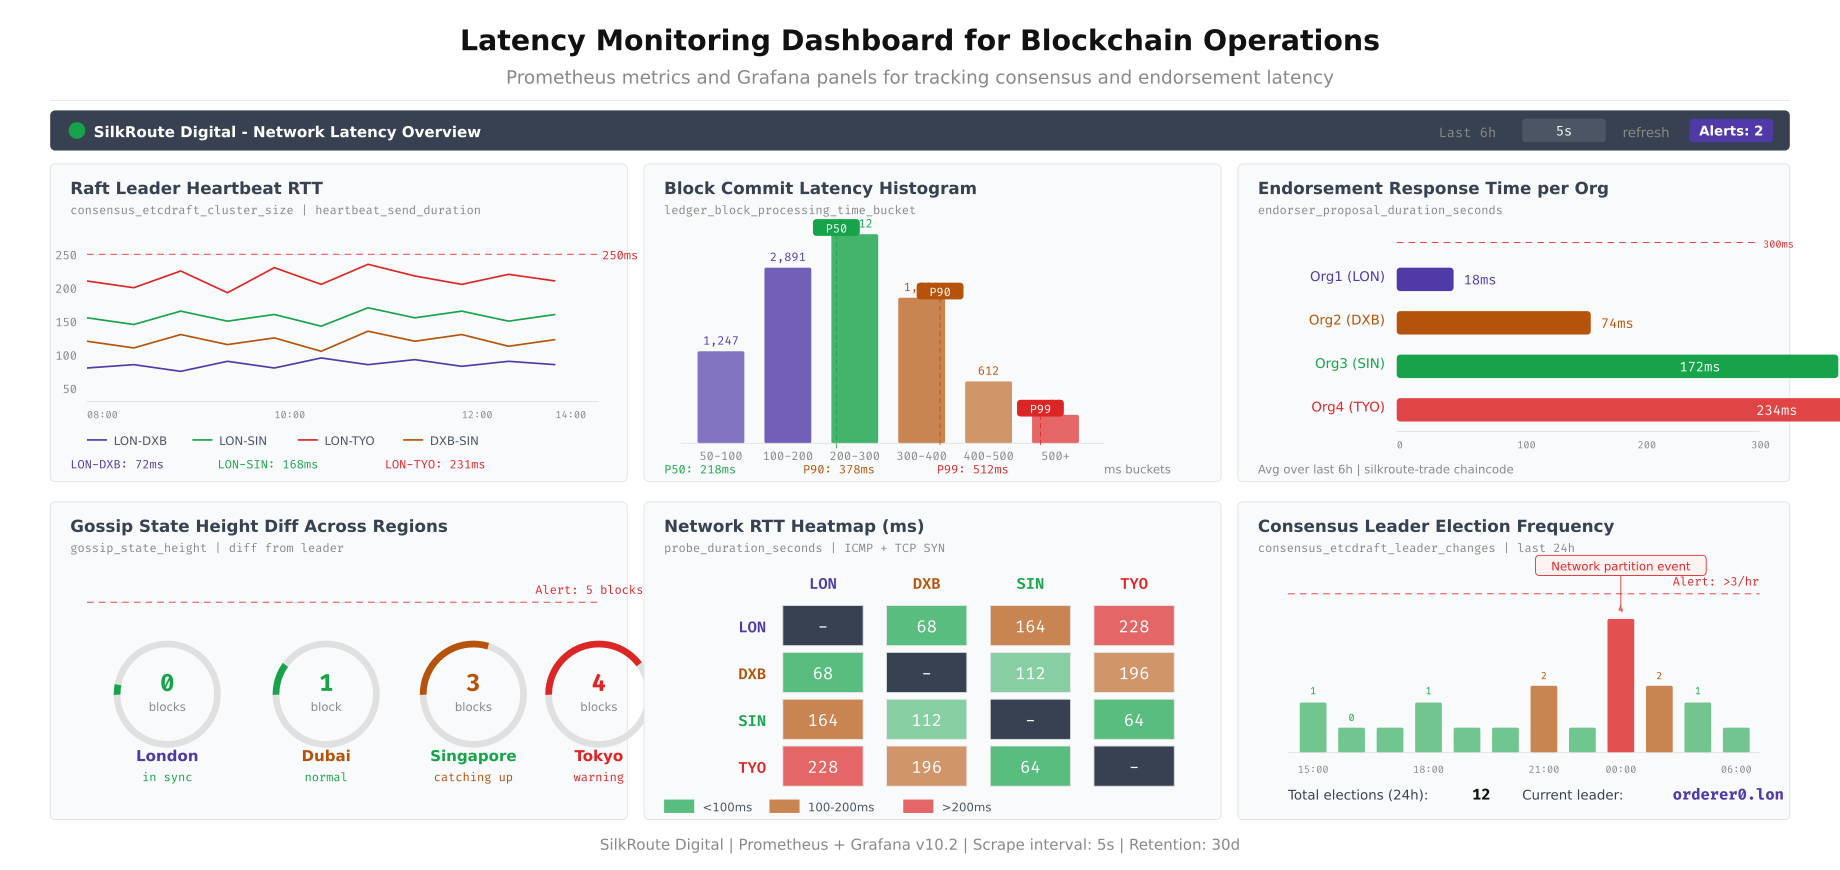
The dashboard layout shown above provides a single view for blockchain network latency health. The top-left RTT heatmap shows real-time latency between all DC pairs using color-coded cells. The leader election panel tracks Raft stability, where spikes indicate latency-induced elections. The block commit latency panel shows P50/P95/P99 processing times. The Gossip propagation panel traces how quickly new blocks reach all peers. The endorsement timing panel compares response times per organization. The consensus round panel monitors IBFT 2.0 round durations and round change events.
# Grafana dashboard provisioning for blockchain latency monitoring
# /etc/grafana/provisioning/dashboards/blockchain-latency.json

{
  "dashboard": {
    "title": "Blockchain Network Latency",
    "tags": ["blockchain", "latency", "consensus"],
    "timezone": "UTC",
    "refresh": "10s",
    "panels": [
      {
        "title": "Inter-Node RTT Heatmap",
        "type": "heatmap",
        "gridPos": {"h": 8, "w": 12, "x": 0, "y": 0},
        "targets": [{
          "expr": "blockchain_node_rtt_ms",
          "legendFormat": "{{source}} → {{target}}"
        }],
        "fieldConfig": {
          "defaults": {
            "color": {
              "mode": "continuous-GrYlRd"
            },
            "thresholds": {
              "steps": [
                {"color": "green", "value": 0},
                {"color": "yellow", "value": 100},
                {"color": "red", "value": 250}
              ]
            }
          }
        }
      },
      {
        "title": "Raft Leader Elections",
        "type": "timeseries",
        "gridPos": {"h": 8, "w": 12, "x": 12, "y": 0},
        "targets": [{
          "expr": "increase(fabric_consensus_etcdraft_leader_changes[5m])",
          "legendFormat": "elections/5m"
        }]
      },
      {
        "title": "Block Commit Latency (P50/P95/P99)",
        "type": "timeseries",
        "gridPos": {"h": 8, "w": 12, "x": 0, "y": 8},
        "targets": [
          {
            "expr": "histogram_quantile(0.50, rate(fabric_ledger_block_processing_time_bucket[5m]))",
            "legendFormat": "P50"
          },
          {
            "expr": "histogram_quantile(0.95, rate(fabric_ledger_block_processing_time_bucket[5m]))",
            "legendFormat": "P95"
          },
          {
            "expr": "histogram_quantile(0.99, rate(fabric_ledger_block_processing_time_bucket[5m]))",
            "legendFormat": "P99"
          }
        ]
      },
      {
        "title": "Gossip Block Propagation Delay",
        "type": "timeseries",
        "gridPos": {"h": 8, "w": 12, "x": 12, "y": 8},
        "targets": [{
          "expr": "fabric_gossip_state_height - ignoring(instance) group_left max(fabric_gossip_state_height)",
          "legendFormat": "{{instance}} lag (blocks)"
        }]
      },
      {
        "title": "Endorsement Response Time by Org",
        "type": "timeseries",
        "gridPos": {"h": 8, "w": 12, "x": 0, "y": 16},
        "targets": [{
          "expr": "histogram_quantile(0.95, rate(fabric_endorser_proposal_duration_bucket[5m]))",
          "legendFormat": "{{msp_id}} P95"
        }]
      },
      {
        "title": "IBFT Consensus Round Duration",
        "type": "timeseries",
        "gridPos": {"h": 8, "w": 12, "x": 12, "y": 16},
        "targets": [{
          "expr": "rate(besu_ibft_round_change_total[5m])",
          "legendFormat": "round changes/sec"
        }]
      }
    ]
  }
}
Network Path Optimization with Dedicated Circuits
Public internet routing between data centers introduces variable latency due to BGP path changes, congestion at peering points, and suboptimal geographic routing. For consensus-critical blockchain traffic, dedicated network circuits or cloud provider backbone connections reduce both average latency and jitter significantly.
# Compare public internet vs dedicated circuit latency
# Run this test weekly to validate network path quality

#!/bin/bash
# network-path-comparison.sh, Public vs dedicated circuit benchmarking

echo "=== Network Path Quality Report, $(date -Iseconds) ==="
echo ""

TARGETS=(
  "dubai-peer0.silkroute.internal"
  "singapore-peer0.silkroute.internal"
  "tokyo-peer0.silkroute.internal"
)
LABELS=("Dubai" "Singapore" "Tokyo")

for i in "${!TARGETS[@]}"; do
  echo "--- ${LABELS[$i]} ---"

  # Measure via public internet (default route)
  PUB_RTT=$(ping -c 50 -q "${TARGETS[$i]}" 2>/dev/null | \
    grep "rtt" | awk -F'/' '{print $5}')
  PUB_JITTER=$(ping -c 50 -q "${TARGETS[$i]}" 2>/dev/null | \
    grep "rtt" | awk -F'/' '{print $7}' | tr -d ' ms')

  # Measure via dedicated circuit (tagged VLAN/routing table)
  # Assumes dedicated circuit uses routing table 100
  PRIV_RTT=$(ip route exec table 100 ping -c 50 -q "${TARGETS[$i]}" 2>/dev/null | \
    grep "rtt" | awk -F'/' '{print $5}')
  PRIV_JITTER=$(ip route exec table 100 ping -c 50 -q "${TARGETS[$i]}" 2>/dev/null | \
    grep "rtt" | awk -F'/' '{print $7}' | tr -d ' ms')

  echo "  Public:    RTT=${PUB_RTT}ms  Jitter=${PUB_JITTER}ms"
  echo "  Dedicated: RTT=${PRIV_RTT}ms  Jitter=${PRIV_JITTER}ms"
  echo "  Improvement: $(echo "scale=1; ($PUB_RTT - $PRIV_RTT) / $PUB_RTT * 100" | bc)%"
  echo ""
done

# MTR trace to identify routing bottlenecks on public path
echo "=== MTR Trace to Singapore (public internet) ==="
mtr --report --report-cycles 20 singapore-peer0.silkroute.internal

# AWS Direct Connect / Azure ExpressRoute verification
# Check BGP session status for dedicated circuits
echo ""
echo "=== BGP Session Status ==="
sudo birdc show protocols | grep -E "BGP|Direct"
sudo birdc show route count
# SD-WAN policy routing for blockchain traffic prioritization
# Route consensus traffic over dedicated circuits, bulk sync over public internet
# iptables marking for blockchain traffic classification
# Mark Fabric orderer traffic (port 7050) as high-priority
sudo iptables -t mangle -A OUTPUT -p tcp --dport 7050 -j MARK --set-mark 0x1
# Mark Fabric peer gossip (port 7051) as high-priority
sudo iptables -t mangle -A OUTPUT -p tcp --dport 7051 -j MARK --set-mark 0x1
# Mark Besu P2P (port 30303) as high-priority
sudo iptables -t mangle -A OUTPUT -p tcp --dport 30303 -j MARK --set-mark 0x1
sudo iptables -t mangle -A OUTPUT -p udp --dport 30303 -j MARK --set-mark 0x1
# Route marked traffic via dedicated circuit (routing table 100)
sudo ip rule add fwmark 0x1 table 100
# Default: bulk traffic (backups, log shipping) uses public internet
# Verify routing
echo "Consensus traffic path:"
ip route get 10.20.30.40 mark 0x1
echo ""
echo "Bulk traffic path:"
ip route get 10.20.30.40
# QoS: Prioritize consensus packets with DSCP marking
# EF (Expedited Forwarding) for consensus, AF21 for gossip
sudo tc qdisc add dev eth0 root handle 1: htb default 30
sudo tc class add dev eth0 parent 1: classid 1:10 htb rate 5gbit ceil 10gbit prio 1
sudo tc class add dev eth0 parent 1: classid 1:20 htb rate 3gbit ceil 10gbit prio 2
sudo tc class add dev eth0 parent 1: classid 1:30 htb rate 2gbit ceil 10gbit prio 3
# Consensus traffic → highest priority queue
sudo tc filter add dev eth0 parent 1: protocol ip prio 1 \
handle 0x1 fw classid 1:10
# All other traffic → default queue
sudo tc filter add dev eth0 parent 1: protocol ip prio 3 \
u32 match u32 0 0 classid 1:30Practical Latency Testing and Validation
Before deploying SilkRoute Digital's production network, a structured latency validation test suite confirms that the entire stack handles the measured inter-DC latencies without consensus failures or unacceptable TPS degradation. This test suite runs automatically as part of the pre-production deployment pipeline.
# Pre-production latency validation test suite
# Run from the deployment orchestrator before promoting to production

#!/bin/bash
# latency-validation-suite.sh, Complete pre-production latency testing

set -e
LOG_FILE="latency-validation-$(date +%Y%m%d_%H%M%S).log"
PASS=0
FAIL=0

log() { echo "[$(date -Iseconds)] $1" | tee -a "$LOG_FILE"; }
assert() {
  if eval "$1"; then
    log "[PASS] $2"
    ((PASS++))
  else
    log "[FAIL] $2, Condition: $1"
    ((FAIL++))
  fi
}

log "=== SilkRoute Digital Latency Validation Suite ==="
log "Testing against 4-DC deployment: London, Dubai, Singapore, Tokyo"

# Test 1: Verify all inter-DC latencies are within expected ranges
log ""
log "--- Test 1: Inter-DC Latency Verification ---"

LON_DXB=$(hping3 -S -p 7051 -c 20 dubai-peer0.silkroute.internal 2>&1 | \
  grep "round-trip" | awk -F'/' '{printf "%.0f", $5}')
assert "[ $LON_DXB -lt 100 ]" "London-Dubai RTT ${LON_DXB}ms < 100ms"

LON_SIN=$(hping3 -S -p 7051 -c 20 singapore-peer0.silkroute.internal 2>&1 | \
  grep "round-trip" | awk -F'/' '{printf "%.0f", $5}')
assert "[ $LON_SIN -lt 200 ]" "London-Singapore RTT ${LON_SIN}ms < 200ms"

LON_TYO=$(hping3 -S -p 7051 -c 20 tokyo-peer0.silkroute.internal 2>&1 | \
  grep "round-trip" | awk -F'/' '{printf "%.0f", $5}')
assert "[ $LON_TYO -lt 250 ]" "London-Tokyo RTT ${LON_TYO}ms < 250ms"

# Test 2: Raft leader stability under measured latency
log ""
log "--- Test 2: Raft Leader Stability (5-minute observation) ---"

INITIAL_LEADER=$(peer channel fetch config -c silkroute-trade -o orderer0-london:7050 \
  --tls --cafile /opt/fabric/tls/orderer-ca.crt 2>&1 | grep -oP 'orderer\d+-\w+')
sleep 300
FINAL_LEADER=$(peer channel fetch config -c silkroute-trade -o orderer0-london:7050 \
  --tls --cafile /opt/fabric/tls/orderer-ca.crt 2>&1 | grep -oP 'orderer\d+-\w+')
assert "[ '$INITIAL_LEADER' = '$FINAL_LEADER' ]" \
  "Raft leader stable for 5 min ($INITIAL_LEADER)"

# Test 3: Block production rate under load
log ""
log "--- Test 3: Block Production Rate ---"

HEIGHT_START=$(peer channel getinfo -c silkroute-trade 2>/dev/null | grep -oP 'height:\K[0-9]+')
# Submit 100 transactions
for i in $(seq 1 100); do
  peer chaincode invoke -C silkroute-trade -n trade-contract \
    --peerAddresses london-peer0.silkroute.internal:7051 \
    --tlsRootCertFiles /opt/fabric/tls/london-ca.crt \
    -c "{\"function\":\"Ping\",\"Args\":[\"$i\"]}" \
    --tls --cafile /opt/fabric/tls/orderer-ca.crt 2>/dev/null &
done
wait
sleep 10
HEIGHT_END=$(peer channel getinfo -c silkroute-trade 2>/dev/null | grep -oP 'height:\K[0-9]+')
BLOCKS=$((HEIGHT_END - HEIGHT_START))
assert "[ $BLOCKS -ge 5 ]" "Produced $BLOCKS blocks for 100 txns"

# Test 4: Cross-DC endorsement latency
log ""
log "--- Test 4: Cross-DC Endorsement Latency ---"

START=$(date +%s%N)
peer chaincode invoke -C silkroute-trade -n trade-contract \
  --peerAddresses london-peer0.silkroute.internal:7051 \
  --peerAddresses dubai-peer0.silkroute.internal:7051 \
  --peerAddresses singapore-peer0.silkroute.internal:7051 \
  --tlsRootCertFiles /opt/fabric/tls/london-ca.crt \
  --tlsRootCertFiles /opt/fabric/tls/dubai-ca.crt \
  --tlsRootCertFiles /opt/fabric/tls/singapore-ca.crt \
  -c '{"function":"Ping","Args":["latency-test"]}' \
  --waitForEvent \
  --tls --cafile /opt/fabric/tls/orderer-ca.crt 2>/dev/null
END=$(date +%s%N)
ENDORSEMENT_MS=$(( (END - START) / 1000000 ))
assert "[ $ENDORSEMENT_MS -lt 2000 ]" \
  "3-org endorsement completed in ${ENDORSEMENT_MS}ms"

# Test 5: Gossip sync verification across all DCs
log ""
log "--- Test 5: Gossip Sync Across All DCs ---"
sleep 15  # Allow Gossip propagation

for PEER in london-peer0 dubai-peer0 singapore-peer0 tokyo-peer0; do
  HEIGHT=$(peer channel getinfo -c silkroute-trade \
    --peerAddresses ${PEER}.silkroute.internal:7051 \
    --tlsRootCertFiles /opt/fabric/tls/${PEER%%-*}-ca.crt 2>/dev/null | \
    grep -oP 'height:\K[0-9]+')
  LAG=$((HEIGHT_END - HEIGHT))
  assert "[ $LAG -le 2 ]" "${PEER} at height $HEIGHT (lag: $LAG blocks)"
done

# Summary
log ""
log "=== Results: $PASS passed, $FAIL failed ==="
[ $FAIL -eq 0 ] && log "DEPLOYMENT APPROVED" || log "DEPLOYMENT BLOCKED, Fix failures before proceeding"
This validation suite runs five test categories: inter-DC latency verification against expected baselines, Raft leader stability over a 5-minute observation period, block production rate under transaction load, cross-DC endorsement round-trip timing, and Gossip sync convergence across all data centers. All five categories must pass before the network is approved for production traffic. SilkRoute Digital runs this suite weekly as part of their operational health checks, with automated Slack alerts on any regression.