
CaspianTrade, a commodity trading consortium headquartered in Delhi, India, learned this the hard way. CaspianTrade operates a Hyperledger Fabric 2.5 network processing 9,200 daily commodity futures transactions for 18 trading firms. Their infrastructure spans three data centers in Delhi, Mumbai, and Chennai, running 8 validator nodes, 14 peer nodes with CouchDB state databases, 6 Raft orderers, and 4 Fabric CA instances. In March 2026, a silent disk exhaustion on their Mumbai orderer caused a 3-hour network partition that halted 2,400 pending trades worth $14.2 million. The post-mortem revealed that disk usage had been climbing at 1.8GB per day for two weeks. A simple monitoring alert at 80% would have given the team 4 days of lead time to expand the volume. That incident triggered a complete monitoring buildout using Prometheus and Node Exporter across every node in the consortium.
Free to use, share it in your presentations, blogs, or learning materials.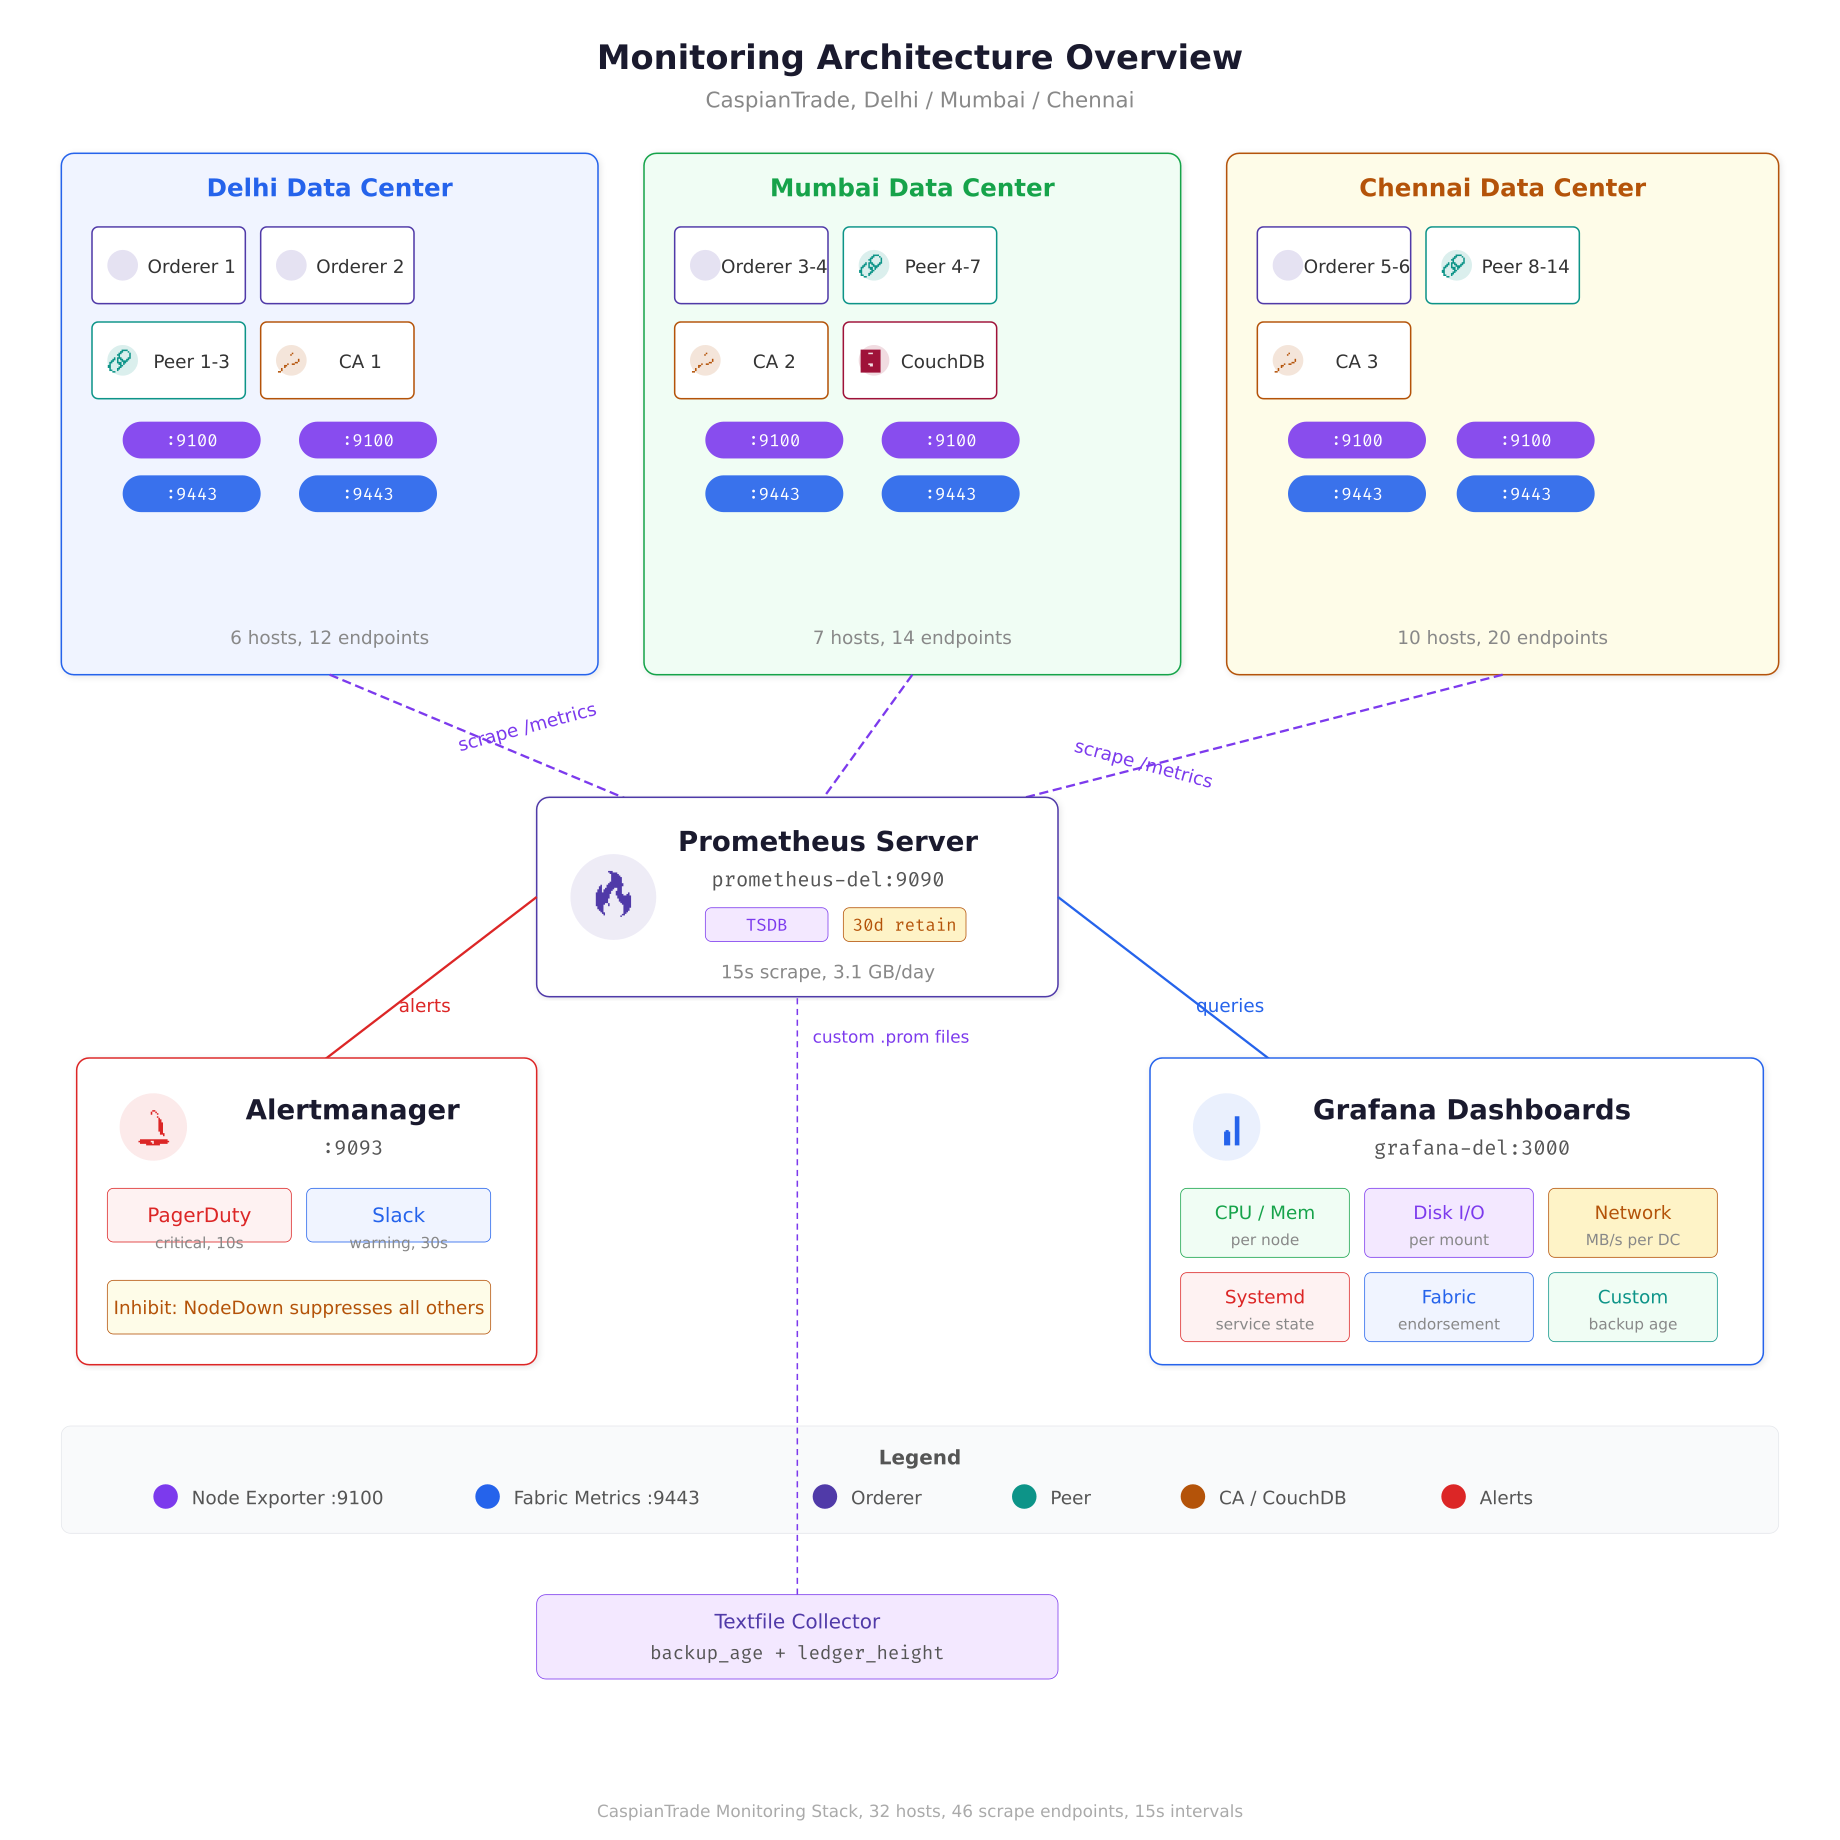
The architecture diagram above maps CaspianTrade’s entire monitoring pipeline. Each blockchain host runs two metric endpoints: Node Exporter on port 9100 for OS-level counters and the Fabric operations server on port 9443 for application metrics. A single Prometheus server in the Delhi data center scrapes all 46 endpoints every 15 seconds, stores 30 days of data in its local TSDB, and evaluates alert rules continuously. Alerts route through Alertmanager to PagerDuty for critical issues and Slack for warnings, while Grafana provides real-time dashboards for the operations team.
Before You Start
This article assumes your blockchain nodes are already running as systemd services with proper dependency ordering, restart policies, and resource controls. If you have not done that yet, start with Running Blockchain Nodes as Systemd Services where MeridianChain configured unit files for every Fabric component. The kernel tuning parameters covered in Kernel and sysctl Tuning for High-Performance Nodes are also relevant here, because several Prometheus metrics directly map to the sysctl values you tuned in that article. The disk layout decisions from Disk Layout Strategy for Blockchain Data will determine which mount points you need to monitor most aggressively.
Why Node Exporter and Not Just Application Metrics
Hyperledger Fabric exposes its own Prometheus metrics endpoint on port 9443, covering things like endorsement latency, block commit time, and chaincode execution duration. Those application-level metrics are valuable, but they tell you what the blockchain is doing, not what the machine underneath is doing. Node Exporter fills the gap by exposing OS-level metrics: CPU usage per core, memory pressure, disk I/O latency, network throughput, filesystem capacity, and hundreds of kernel-level counters. When a Fabric peer reports high endorsement latency, Node Exporter helps you determine whether the root cause is CPU saturation, disk I/O contention, or memory swapping. Without that layer, you are debugging application behavior without any visibility into the infrastructure that supports it.
CaspianTrade collects both layers. Their Prometheus server scrapes Fabric metrics from port 9443 on every peer and orderer, and Node Exporter metrics from port 9100 on every machine. The correlation between these two layers is what makes alerting actionable. A spike in block commit time combined with a spike in disk write latency points directly at storage throughput. The same commit time spike with normal disk metrics points at network latency between the orderer and peer.
Installing Node Exporter as a Systemd Service
CaspianTrade deploys Node Exporter as a native binary managed by systemd on every host in the network. They deliberately avoid running it in Docker containers because Node Exporter needs direct access to the host’s /proc and /sys filesystems. Running it inside a container adds a layer of filesystem isolation that can cause metrics to report container-level values instead of host-level values, which defeats the entire purpose.
Start by creating a dedicated system user with no login shell and no home directory. This user runs the Node Exporter process with minimal privileges.
$ sudo useradd –no-create-home –shell /usr/sbin/nologin node_exporterDownload the latest stable release from the Prometheus GitHub releases page. CaspianTrade pins the version at 1.8.2 across all nodes to avoid inconsistent metric names between versions.
$ cd /home/bigadmin/scripts/gslblogs/tmp
$ curl -LO https://github.com/prometheus/node_exporter/releases/download/v1.8.2/node_exporter-1.8.2.linux-amd64.tar.gz
$ tar xzf node_exporter-1.8.2.linux-amd64.tar.gz
$ sudo cp node_exporter-1.8.2.linux-amd64/node_exporter /usr/local/bin/
$ sudo chown node_exporter:node_exporter /usr/local/bin/node_exporter
Verify the binary runs and prints its version string. If this step fails, the binary may not match your CPU architecture.
$ node_exporter –versionnode_exporter, version 1.8.2 (branch: HEAD, revision: 6bf18b6caa)
build user: root@6bf18b6caa
build date: 20240714-15:42:12
go version: go1.22.5
platform: linux/amd64
tags: unknownNow create the systemd unit file. CaspianTrade enables only the collectors they actually need, rather than running all 40+ default collectors. This reduces the scrape payload size from ~45KB to ~12KB per node and cuts Prometheus storage consumption by roughly 60%.
[Unit]
Description=Prometheus Node Exporter, CaspianTrade Blockchain Monitoring
Documentation=https://prometheus.io/docs/guides/node-exporter/
After=network-online.target
Wants=network-online.target

[Service]
Type=simple
User=node_exporter
Group=node_exporter
ExecStart=/usr/local/bin/node_exporter \
  –web.listen-address=”:9100″ \
  –collector.cpu \
  –collector.meminfo \
  –collector.diskstats \
  –collector.filesystem \
  –collector.loadavg \
  –collector.netdev \
  –collector.vmstat \
  –collector.pressure \
  –collector.systemd \
  –collector.textfile \
  –collector.textfile.directory=/var/lib/node_exporter/textfile \
  –no-collector.arp \
  –no-collector.bcache \
  –no-collector.bonding \
  –no-collector.btrfs \
  –no-collector.conntrack \
  –no-collector.edac \
  –no-collector.entropy \
  –no-collector.fibrechannel \
  –no-collector.hwmon \
  –no-collector.infiniband \
  –no-collector.ipvs \
  –no-collector.mdadm \
  –no-collector.nfs \
  –no-collector.nfsd \
  –no-collector.nvme \
  –no-collector.powersupplyclass \
  –no-collector.rapl \
  –no-collector.schedstat \
  –no-collector.sockstat \
  –no-collector.softnet \
  –no-collector.tapestats \
  –no-collector.thermal_zone \
  –no-collector.timex \
  –no-collector.xfs \
  –no-collector.zfs

Restart=on-failure
RestartSec=5
StartLimitBurst=3
StartLimitIntervalSec=60

SyslogIdentifier=node-exporter
StandardOutput=journal
StandardError=journal

ProtectSystem=full
ProtectHome=yes
NoNewPrivileges=yes
ReadOnlyPaths=/proc /sys

[Install]
WantedBy=multi-user.target
The --collector.systemd flag is particularly important for blockchain nodes. It exposes the state of every systemd service as a Prometheus metric, so you can alert when fabric-peer.service or fabric-orderer.service enters a failed state. The --collector.textfile flag enables custom metrics that CaspianTrade writes from cron jobs, such as the age of the latest blockchain backup or the number of pending chaincode proposals. The --collector.pressure flag exposes PSI (Pressure Stall Information) metrics from the kernel, which reveal when CPU, memory, or I/O contention is actually stalling processes, not just showing high utilization numbers.
The security directives at the bottom deserve attention. ProtectSystem=full mounts /usr, /boot, and /etc as read-only for the Node Exporter process. ProtectHome=yes makes /home, /root, and /run/user inaccessible. NoNewPrivileges=yes prevents the process from gaining additional Linux capabilities through setuid binaries. These controls ensure that even if Node Exporter is compromised, the attacker cannot modify system files or read user data.
Create the textfile collector directory and enable the service.
$ sudo mkdir -p /var/lib/node_exporter/textfile
$ sudo chown node_exporter:node_exporter /var/lib/node_exporter/textfile
$ sudo systemctl daemon-reload
$ sudo systemctl enable node_exporter.service
$ sudo systemctl start node_exporter.service
$ sudo systemctl status node_exporter.service● node_exporter.service – Prometheus Node Exporter, CaspianTrade Blockchain Monitoring
Loaded: loaded (/etc/systemd/system/node_exporter.service; enabled; preset: enabled)
Active: active (running) since Sat 2026-04-05 14:22:31 IST; 2s ago
Docs: https://prometheus.io/docs/guides/node-exporter/
Main PID: 48291 (node_exporter)
Tasks: 6 (limit: 38243)
Memory: 11.2M
CPU: 42ms
CGroup: /system.slice/node_exporter.service
└─48291 /usr/local/bin/node_exporter –web.listen-address=:9100 …Verify the metrics endpoint is responding by curling localhost on port 9100.
$ curl -s http://localhost:9100/metrics | head -20# HELP node_cpu_seconds_total Seconds the CPUs spent in each mode.
# TYPE node_cpu_seconds_total counter
node_cpu_seconds_total{cpu=”0″,mode=”idle”} 1.284723e+06
node_cpu_seconds_total{cpu=”0″,mode=”iowait”} 1842.17
node_cpu_seconds_total{cpu=”0″,mode=”irq”} 0
node_cpu_seconds_total{cpu=”0″,mode=”nice”} 12.44
node_cpu_seconds_total{cpu=”0″,mode=”softirq”} 3841.22
node_cpu_seconds_total{cpu=”0″,mode=”steal”} 0
node_cpu_seconds_total{cpu=”0″,mode=”system”} 48291.83
node_cpu_seconds_total{cpu=”0″,mode=”user”} 124872.41Configuring Prometheus to Scrape Blockchain Nodes
CaspianTrade runs a single Prometheus server on a dedicated monitoring host in their Delhi data center. This server scrapes metrics from all 32 hosts across three data centers every 15 seconds. The choice of 15-second intervals balances metric granularity against storage consumption. At 10-second intervals, CaspianTrade’s 32-node cluster generated 4.8GB of TSDB data per day. Switching to 15 seconds dropped that to 3.1GB per day with negligible impact on alert responsiveness.
The Prometheus configuration file organizes scrape targets into job groups, separating Node Exporter metrics from Fabric application metrics. This separation makes it easy to apply different relabeling rules and retention policies to each metric type.
global:
  scrape_interval: 15s
  evaluation_interval: 15s
  scrape_timeout: 10s

alerting:
  alertmanagers:
    – static_configs:
        – targets:
            – ‘alertmanager-delhi.caspiantrade.internal:9093’

rule_files:
  – ‘/etc/prometheus/rules/node_alerts.yml’
  – ‘/etc/prometheus/rules/fabric_alerts.yml’
  – ‘/etc/prometheus/rules/recording_rules.yml’

scrape_configs:
  # Node Exporter, OS-level metrics from every host
  – job_name: ‘node-exporter’
    static_configs:
      # Delhi DC
      – targets:
          – ‘orderer1-del.caspiantrade.internal:9100’
          – ‘orderer2-del.caspiantrade.internal:9100’
          – ‘peer1-del.caspiantrade.internal:9100’
          – ‘peer2-del.caspiantrade.internal:9100’
          – ‘peer3-del.caspiantrade.internal:9100’
          – ‘ca1-del.caspiantrade.internal:9100’
        labels:
          datacenter: ‘delhi’
          environment: ‘production’

      # Mumbai DC
      – targets:
          – ‘orderer3-mum.caspiantrade.internal:9100’
          – ‘orderer4-mum.caspiantrade.internal:9100’
          – ‘peer4-mum.caspiantrade.internal:9100’
          – ‘peer5-mum.caspiantrade.internal:9100’
          – ‘peer6-mum.caspiantrade.internal:9100’
          – ‘peer7-mum.caspiantrade.internal:9100’
          – ‘ca2-mum.caspiantrade.internal:9100’
        labels:
          datacenter: ‘mumbai’
          environment: ‘production’

      # Chennai DC
      – targets:
          – ‘orderer5-chn.caspiantrade.internal:9100’
          – ‘orderer6-chn.caspiantrade.internal:9100’
          – ‘peer8-chn.caspiantrade.internal:9100’
          – ‘peer9-chn.caspiantrade.internal:9100’
          – ‘peer10-chn.caspiantrade.internal:9100’
          – ‘peer11-chn.caspiantrade.internal:9100’
          – ‘peer12-chn.caspiantrade.internal:9100’
          – ‘peer13-chn.caspiantrade.internal:9100’
          – ‘peer14-chn.caspiantrade.internal:9100’
          – ‘ca3-chn.caspiantrade.internal:9100’
        labels:
          datacenter: ‘chennai’
          environment: ‘production’

  # Fabric application metrics
  – job_name: ‘fabric-metrics’
    scheme: https
    tls_config:
      ca_file: /etc/prometheus/certs/fabric-ca.pem
      insecure_skip_verify: false
    static_configs:
      – targets:
          – ‘peer1-del.caspiantrade.internal:9443’
          – ‘peer2-del.caspiantrade.internal:9443’
          – ‘peer3-del.caspiantrade.internal:9443’
          – ‘peer4-mum.caspiantrade.internal:9443’
          – ‘peer5-mum.caspiantrade.internal:9443’
          – ‘orderer1-del.caspiantrade.internal:9443’
          – ‘orderer3-mum.caspiantrade.internal:9443’
          – ‘orderer5-chn.caspiantrade.internal:9443’
        labels:
          environment: ‘production’
The datacenter label is critical. Every alert rule and Grafana dashboard query filters by datacenter, which lets the on-call engineer immediately know whether the problem is in Delhi, Mumbai, or Chennai without digging through hostnames. The environment label exists because CaspianTrade also runs a staging cluster in Delhi that uses the same Prometheus server but different alert routing. Staging alerts go to a Slack channel; production alerts go to PagerDuty.
The Fabric metrics job uses HTTPS with a TLS CA certificate because Fabric’s operations endpoint enforces mutual TLS in CaspianTrade’s configuration. The insecure_skip_verify: false ensures Prometheus validates the server certificate against the CA, which prevents man-in-the-middle attacks on the metrics pipeline.
Critical Alert Rules for Blockchain Infrastructure
CaspianTrade’s alert rules are split into two files: node_alerts.yml for infrastructure-level alerts and fabric_alerts.yml for application-level alerts. The infrastructure alerts fire based on Node Exporter metrics and apply to every machine in the consortium, regardless of what blockchain component it runs.
The alert rule file below covers the six failure scenarios that caused the most downtime in CaspianTrade’s first year of operation. Each rule includes a for duration that prevents flapping: the condition must be true continuously for the specified duration before the alert fires.
groups:
  – name: blockchain_node_infrastructure
    interval: 15s
    rules:

      # Disk space, the one that caused the $14.2M incident
      – alert: DiskSpaceCritical
        expr: |
          (node_filesystem_avail_bytes{mountpoint=~”/opt/fabric|/var/lib/couchdb|/var/lib/docker”}
          / node_filesystem_size_bytes) * 100 < 15
        for: 5m
        labels:
          severity: critical
          team: infrastructure
        annotations:
          summary: "Disk space below 15% on {{ $labels.instance }}"
          description: "Mount {{ $labels.mountpoint }} has {{ printf \"%.1f\" $value }}% free space remaining"
          runbook: "https://wiki.caspiantrade.internal/runbooks/disk-expansion"

      - alert: DiskSpaceWarning
        expr: |
          (node_filesystem_avail_bytes{mountpoint=~"/opt/fabric|/var/lib/couchdb|/var/lib/docker"}
          / node_filesystem_size_bytes) * 100 < 25
        for: 10m
        labels:
          severity: warning
          team: infrastructure
        annotations:
          summary: "Disk space below 25% on {{ $labels.instance }}"
          description: "Mount {{ $labels.mountpoint }} has {{ printf \"%.1f\" $value }}% free space"

      # CPU sustained high usage
      - alert: CPUSaturation
        expr: |
          100 - (avg by(instance) (rate(node_cpu_seconds_total{mode="idle"}[5m])) * 100) > 90
        for: 10m
        labels:
          severity: critical
          team: infrastructure
        annotations:
          summary: “CPU above 90% for 10 minutes on {{ $labels.instance }}”
          description: “Sustained CPU at {{ printf \”%.1f\” $value }}% indicates endorsement overload or runaway process”

      # Memory pressure using PSI metrics
      – alert: MemoryPressureHigh
        expr: |
          rate(node_pressure_memory_stalled_seconds_total[5m]) > 0.1
        for: 5m
        labels:
          severity: critical
          team: infrastructure
        annotations:
          summary: “Memory pressure stalling processes on {{ $labels.instance }}”
          description: “PSI memory stall rate {{ printf \”%.3f\” $value }}s/s, processes are waiting for memory”

      # Disk I/O latency, catches degrading SSDs early
      – alert: DiskIOLatencyHigh
        expr: |
          rate(node_disk_io_time_weighted_seconds_total[5m])
          / rate(node_disk_io_time_seconds_total[5m]) > 0.05
        for: 10m
        labels:
          severity: warning
          team: infrastructure
        annotations:
          summary: “Disk I/O latency elevated on {{ $labels.instance }}”
          description: “Average I/O wait time exceeds 50ms, which degrades CouchDB query performance”

      # Systemd service failure, catches crashed Fabric components
      – alert: SystemdServiceFailed
        expr: |
          node_systemd_unit_state{name=~”fabric-.*|couchdb.*|node_exporter.*”,state=”failed”} == 1
        for: 30s
        labels:
          severity: critical
          team: blockchain
        annotations:
          summary: “Service {{ $labels.name }} failed on {{ $labels.instance }}”
          description: “Systemd reports {{ $labels.name }} in failed state, check journalctl for details”

      # Network receive errors, catches cable/NIC issues early
      – alert: NetworkReceiveErrors
        expr: |
          rate(node_network_receive_errs_total{device!~”lo|docker.*|veth.*”}[5m]) > 0
        for: 5m
        labels:
          severity: warning
          team: infrastructure
        annotations:
          summary: “Network receive errors on {{ $labels.instance }} device {{ $labels.device }}”
          description: “{{ printf \”%.0f\” $value }} errors/sec, check cable, NIC, or switch port”

      # Node Exporter itself down, meta-monitoring
      – alert: NodeExporterDown
        expr: up{job=”node-exporter”} == 0
        for: 2m
        labels:
          severity: critical
          team: infrastructure
        annotations:
          summary: “Node Exporter unreachable on {{ $labels.instance }}”
          description: “Prometheus cannot scrape {{ $labels.instance }}, host may be down or firewall blocking port 9100”
The DiskSpaceCritical alert specifically monitors the three mount points that matter for blockchain nodes: /opt/fabric (where binaries, configs, and ledger data live), /var/lib/couchdb (state database), and /var/lib/docker (chaincode container images and layers). Monitoring root (/) alone is not enough because CaspianTrade uses separate partitions for blockchain data, which is exactly what was recommended in the disk layout article. A full /var/lib/couchdb will crash CouchDB while root still shows 60% free.
The MemoryPressureHigh alert uses PSI (Pressure Stall Information) instead of simple memory percentage. This matters because a node showing 92% memory usage might be perfectly healthy if most of that memory is filesystem cache (which the kernel reclaims on demand). PSI measures whether processes are actually stalling due to memory contention, which is the real indicator of trouble. CaspianTrade found that their CouchDB nodes routinely run at 88% memory utilization with zero PSI pressure, because CouchDB aggressively uses RAM for its view index cache.
Custom Metrics via the Textfile Collector
Node Exporter’s textfile collector reads .prom files from a directory and exposes their contents as Prometheus metrics. CaspianTrade uses this to track blockchain-specific infrastructure metrics that neither Node Exporter nor Fabric’s built-in metrics cover.
The first custom metric tracks the age of the most recent blockchain backup. If the backup age exceeds 26 hours (their backup runs every 24 hours), an alert fires.
#!/bin/bash
# Writes backup age metric for Node Exporter textfile collector
# Runs via cron every 15 minutes

BACKUP_DIR=”/opt/fabric/backups”
METRIC_FILE=”/var/lib/node_exporter/textfile/backup_age.prom”
LATEST=$(find “$BACKUP_DIR” -name “*.tar.gz” -type f -printf ‘%T@\n’ 2>/dev/null | sort -rn | head -1)

if [ -z “$LATEST” ]; then
    AGE=999999
else
    NOW=$(date +%s)
    AGE=$(echo “$NOW – ${LATEST%.*}” | bc)
fi

cat > “$METRIC_FILE” <<EOF
# HELP caspiantrade_backup_age_seconds Seconds since the most recent blockchain backup
# TYPE caspiantrade_backup_age_seconds gauge
caspiantrade_backup_age_seconds $AGE
EOF
[/gsl_terminal]


The second custom metric tracks the ledger height (block number) of each peer. By comparing ledger heights across peers, CaspianTrade detects peers that have fallen behind in block synchronization.


[gsl_terminal type="config" title="/opt/fabric/scripts/ledger-height-metric.sh"]
#!/bin/bash
# Writes ledger height metric for Node Exporter textfile collector
# Runs via cron every 60 seconds

METRIC_FILE=”/var/lib/node_exporter/textfile/ledger_height.prom”
CHANNEL=”commodities-channel”

HEIGHT=$(peer channel getinfo -c “$CHANNEL” 2>/dev/null | grep -oP ‘Blockchain info: \{Height:\K[0-9]+’)

if [ -z “$HEIGHT” ]; then
    HEIGHT=0
fi

cat > “$METRIC_FILE” <<EOF
# HELP caspiantrade_ledger_height Current block height of the peer ledger
# TYPE caspiantrade_ledger_height gauge
caspiantrade_ledger_height{channel="$CHANNEL"} $HEIGHT
EOF
[/gsl_terminal]


Register both scripts in cron for the fabric user.


[gsl_terminal type="command" title="Add cron entries for custom metrics"]
sudo crontab -u fabric -e*/15 * * * * /opt/fabric/scripts/backup-age-metric.sh
* * * * * /opt/fabric/scripts/ledger-height-metric.shThe backup age script runs every 15 minutes because backup freshness does not change rapidly. The ledger height script runs every 60 seconds because block production in CaspianTrade averages one block every 2 seconds during peak hours, and a peer falling 100+ blocks behind needs fast detection.
Free to use, share it in your presentations, blogs, or learning materials.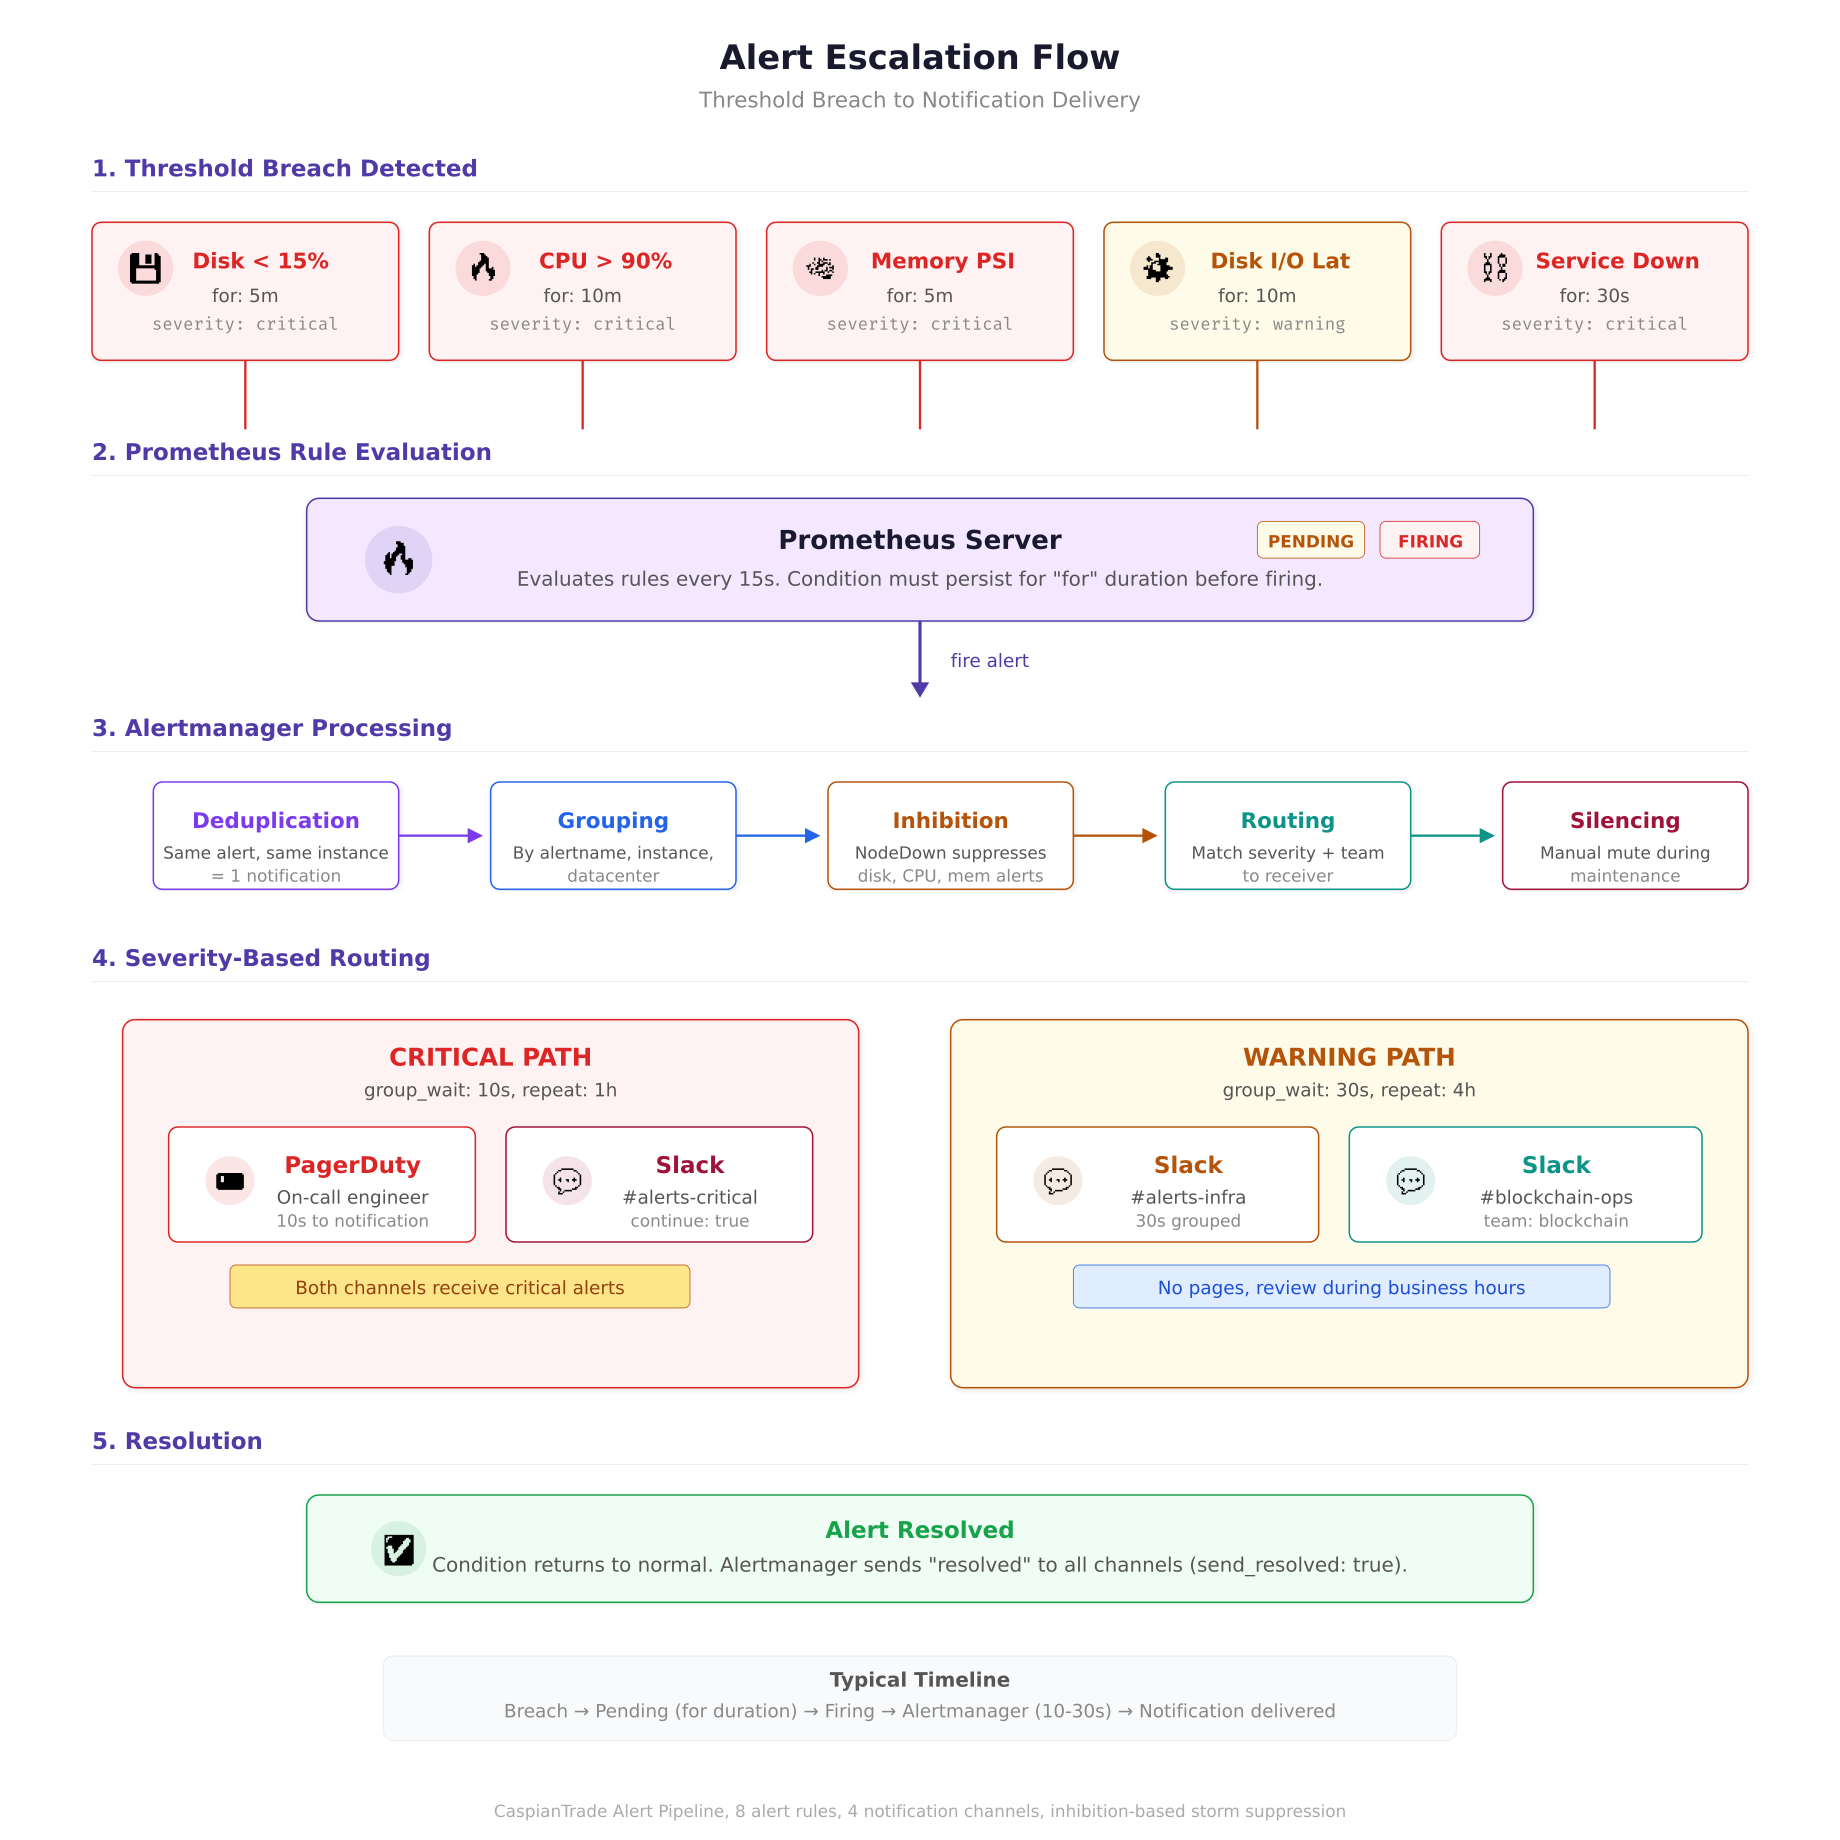
The flow diagram above traces an alert from the moment a threshold is breached to the point where a human receives a notification. The critical path delivers PagerDuty pages within 10 seconds of a firing alert, while warning alerts are grouped for 30 seconds to avoid notification storms. The inhibition stage is where CaspianTrade prevents alert cascades: when a node goes completely offline, one “NodeExporterDown” alert fires instead of seven separate infrastructure alerts for the same dead host.
Alertmanager Routing and Escalation
Prometheus evaluates alert rules and fires alerts to Alertmanager, which handles deduplication, grouping, silencing, and routing to the right notification channel. CaspianTrade routes alerts based on two labels: severity and team.
global:
  resolve_timeout: 5m

route:
  receiver: ‘slack-infrastructure’
  group_by: [‘alertname’, ‘instance’, ‘datacenter’]
  group_wait: 30s
  group_interval: 5m
  repeat_interval: 4h

  routes:
    # Critical alerts, PagerDuty immediately
    – match:
        severity: critical
      receiver: ‘pagerduty-oncall’
      group_wait: 10s
      repeat_interval: 1h
      continue: true

    # Critical alerts also go to Slack for visibility
    – match:
        severity: critical
      receiver: ‘slack-critical’

    # Warning alerts, Slack only
    – match:
        severity: warning
      receiver: ‘slack-infrastructure’

    # Blockchain team alerts
    – match:
        team: blockchain
      receiver: ‘slack-blockchain’

receivers:
  – name: ‘pagerduty-oncall’
    pagerduty_configs:
      – routing_key_file: ‘/etc/alertmanager/secrets/pagerduty_key’
        severity: ‘{{ .GroupLabels.severity }}’
        description: ‘{{ .CommonAnnotations.summary }}’

  – name: ‘slack-critical’
    slack_configs:
      – api_url_file: ‘/etc/alertmanager/secrets/slack_webhook’
        channel: ‘#blockchain-alerts-critical’
        title: ‘[{{ .Status | toUpper }}] {{ .CommonLabels.alertname }}’
        text: ‘{{ .CommonAnnotations.description }}’
        send_resolved: true

  – name: ‘slack-infrastructure’
    slack_configs:
      – api_url_file: ‘/etc/alertmanager/secrets/slack_webhook’
        channel: ‘#blockchain-alerts-infra’
        title: ‘{{ .CommonLabels.alertname }} on {{ .CommonLabels.instance }}’
        text: ‘{{ .CommonAnnotations.description }}’
        send_resolved: true

  – name: ‘slack-blockchain’
    slack_configs:
      – api_url_file: ‘/etc/alertmanager/secrets/slack_webhook’
        channel: ‘#blockchain-ops’
        title: ‘{{ .CommonLabels.alertname }}’
        text: ‘{{ .CommonAnnotations.description }}’
        send_resolved: true

inhibit_rules:
  # If a node is completely down, suppress all other alerts for that node
  – source_match:
      alertname: ‘NodeExporterDown’
    target_match_re:
      alertname: ‘DiskSpace.*|CPUSaturation|MemoryPressure.*|DiskIOLatency.*’
    equal: [‘instance’]
The inhibit rule at the bottom is CaspianTrade’s answer to alert storms. When a host goes completely offline, Node Exporter stops responding, which triggers NodeExporterDown. But the same outage also triggers DiskSpaceCritical, CPUSaturation, and every other alert because Prometheus treats missing metrics as stale. The inhibit rule suppresses all infrastructure alerts for that instance when NodeExporterDown is active, so the on-call engineer gets one clear alert (“host is down”) instead of seven overlapping alerts.
The continue: true on the PagerDuty route ensures that critical alerts go to both PagerDuty and Slack. Without it, the first matching route would swallow the alert and the Slack channel would never see it. The group_wait: 10s on critical alerts means PagerDuty gets notified within 10 seconds of the alert firing. Warning alerts wait 30 seconds to allow for grouping, which avoids spamming Slack when multiple nodes hit the same threshold simultaneously.
Recording Rules for Dashboard Performance
Prometheus recording rules pre-compute expensive queries and store the results as new time series. CaspianTrade uses recording rules for two reasons: to speed up Grafana dashboard load times and to create aggregated metrics that would be too expensive to compute on every dashboard refresh.
groups:
  – name: blockchain_node_recordings
    interval: 30s
    rules:
      # Pre-compute CPU usage percentage per instance
      – record: caspiantrade:node_cpu_usage_percent
        expr: |
          100 – (avg by(instance, datacenter) (rate(node_cpu_seconds_total{mode=”idle”}[5m])) * 100)

      # Pre-compute memory usage percentage
      – record: caspiantrade:node_memory_usage_percent
        expr: |
          (1 – node_memory_MemAvailable_bytes / node_memory_MemTotal_bytes) * 100

      # Pre-compute disk usage percentage per mount
      – record: caspiantrade:node_disk_usage_percent
        expr: |
          (1 – node_filesystem_avail_bytes{mountpoint=~”/opt/fabric|/var/lib/couchdb|/var/lib/docker”}
          / node_filesystem_size_bytes) * 100

      # Pre-compute network throughput in MB/s
      – record: caspiantrade:node_network_receive_mbps
        expr: |
          rate(node_network_receive_bytes_total{device!~”lo|docker.*|veth.*”}[5m]) / 1048576

      – record: caspiantrade:node_network_transmit_mbps
        expr: |
          rate(node_network_transmit_bytes_total{device!~”lo|docker.*|veth.*”}[5m]) / 1048576
Each recording rule uses the caspiantrade: prefix as a namespace, which makes it easy to distinguish pre-computed metrics from raw metrics in Grafana queries. The 30-second evaluation interval means these values update twice per minute, which is frequent enough for dashboard responsiveness without creating excessive TSDB churn.
Firewall Rules for the Monitoring Stack
CaspianTrade restricts which hosts can access the metrics endpoints. Node Exporter listens on port 9100 and should only accept connections from the Prometheus server. Similarly, Prometheus itself on port 9090 and Alertmanager on port 9093 should only be accessible from the Grafana server and internal admin networks.
$ # On every blockchain node, allow Node Exporter only from Prometheus server
$ sudo ufw allow from 10.20.1.50 to any port 9100 proto tcp comment “Prometheus scrape”
$ sudo ufw deny 9100

$ # On the Prometheus server, allow Grafana and admin access
$ sudo ufw allow from 10.20.1.60 to any port 9090 proto tcp comment “Grafana queries”
$ sudo ufw allow from 10.20.0.0/24 to any port 9090 proto tcp comment “Admin network”
$ sudo ufw allow from 10.20.1.60 to any port 9093 proto tcp comment “Grafana to Alertmanager”
The rule ordering matters. The allow rule for the Prometheus server IP must come before the deny-all rule for port 9100, because UFW evaluates rules top to bottom and stops at the first match. Without the explicit deny, port 9100 would be accessible to any host that can reach the machine, exposing detailed system metrics to potential attackers.
Verifying the Full Pipeline
After deploying Node Exporter, configuring Prometheus, and setting up alert rules, CaspianTrade runs a verification sequence to confirm the entire pipeline works end to end. This sequence tests metric collection, alert evaluation, and notification delivery.
First, verify Prometheus can reach all targets by checking the targets page.
$ curl -s http://localhost:9090/api/v1/targets | python3 -m json.tool | grep -E ‘”health”|”job”‘ | head -20“job”: “node-exporter”,
“health”: “up”,
“job”: “node-exporter”,
“health”: “up”,
“job”: “node-exporter”,
“health”: “up”,
“job”: “fabric-metrics”,
“health”: “up”,Next, run a test query against the recording rules to confirm they are producing values.
$ curl -s ‘http://localhost:9090/api/v1/query?query=caspiantrade:node_cpu_usage_percent’ | python3 -m json.tool | head -15Finally, trigger a test alert by temporarily creating a rule that always fires, then check Alertmanager’s API to confirm it received the alert.
$ curl -s http://localhost:9093/api/v2/alerts | python3 -m json.tool | head -20Prometheus Data Retention and Storage Sizing
CaspianTrade retains 30 days of high-resolution metrics in Prometheus’s local TSDB. Beyond 30 days, they downsample to 5-minute intervals and archive to an S3-compatible object store using Thanos Sidecar. This two-tier approach keeps the Prometheus server’s local disk requirements manageable while preserving 12 months of historical data for capacity planning.
The Prometheus startup flags that control retention and storage are set in its systemd unit file.
ExecStart=/usr/local/bin/prometheus \
  –config.file=/etc/prometheus/prometheus.yml \
  –storage.tsdb.path=/var/lib/prometheus/data \
  –storage.tsdb.retention.time=30d \
  –storage.tsdb.retention.size=50GB \
  –storage.tsdb.min-block-duration=2h \
  –storage.tsdb.max-block-duration=24h \
  –web.enable-lifecycle \
  –web.listen-address=”:9090″
The dual retention policy (retention.time=30d and retention.size=50GB) means Prometheus deletes data when either condition is met, whichever comes first. This protects against a scenario where a sudden increase in scrape targets or metric cardinality causes storage to grow faster than expected. CaspianTrade’s 32-node cluster with 15-second scrape intervals consumes approximately 3.1GB per day, so the 50GB limit provides roughly 16 days of headroom beyond the 30-day retention period.
What Comes Next
With Node Exporter and Prometheus in place, CaspianTrade has full visibility into the health of every machine in their blockchain network. They can detect disk exhaustion days before it causes an outage, identify CPU-saturated nodes before endorsement latency degrades, and get paged within 10 seconds when a systemd service crashes. The next article covers Backup and Restore Strategies for Blockchain Nodes, where we walk through snapshot-based backups for CouchDB state databases, ledger-level backups for Fabric peers, and automated restore testing that validates backup integrity before you actually need it in a disaster.
Frequently Asked Questions
No. Node Exporter needs direct access to the host /proc and /sys filesystems to report accurate OS-level metrics. Running it inside a Docker container adds filesystem isolation that causes metrics to report container-level values instead of host-level values. Always install Node Exporter as a native binary managed by systemd on the host.
15 seconds is the recommended interval for production blockchain monitoring. It balances metric granularity against storage consumption. At 10-second intervals, a 32-node cluster generates roughly 4.8 GB of TSDB data per day. Switching to 15 seconds drops that to approximately 3.1 GB per day with negligible impact on alert responsiveness. Only use shorter intervals (5s) for specific high-priority targets like orderer nodes during consensus debugging.
Memory percentage alone is misleading because Linux uses available RAM for filesystem cache, which the kernel reclaims on demand when applications need it. A node showing 92% memory usage might be perfectly healthy if most of that is cache. PSI (Pressure Stall Information) measures whether processes are actually stalling due to memory contention, which is the real indicator of trouble. CouchDB nodes routinely run at 88% memory utilization with zero PSI pressure because CouchDB aggressively caches view indexes.
Use Alertmanager inhibit rules. When a host goes offline, Node Exporter stops responding, which triggers a NodeExporterDown alert. The same outage also triggers disk, CPU, and memory alerts because Prometheus treats missing metrics as stale. An inhibit rule suppresses all infrastructure alerts for that instance when NodeExporterDown is active, so the on-call engineer gets one clear notification instead of seven overlapping alerts for the same dead host.
The textfile collector reads .prom files from a directory and exposes their contents as Prometheus metrics. It allows you to create custom metrics that neither Node Exporter nor your application natively exposes. Common use cases for blockchain nodes include tracking the age of the most recent backup, the current ledger height of each peer, the number of pending chaincode proposals, and certificate expiration dates. Scripts run via cron write these metric files, and Node Exporter picks them up on the next scrape.