
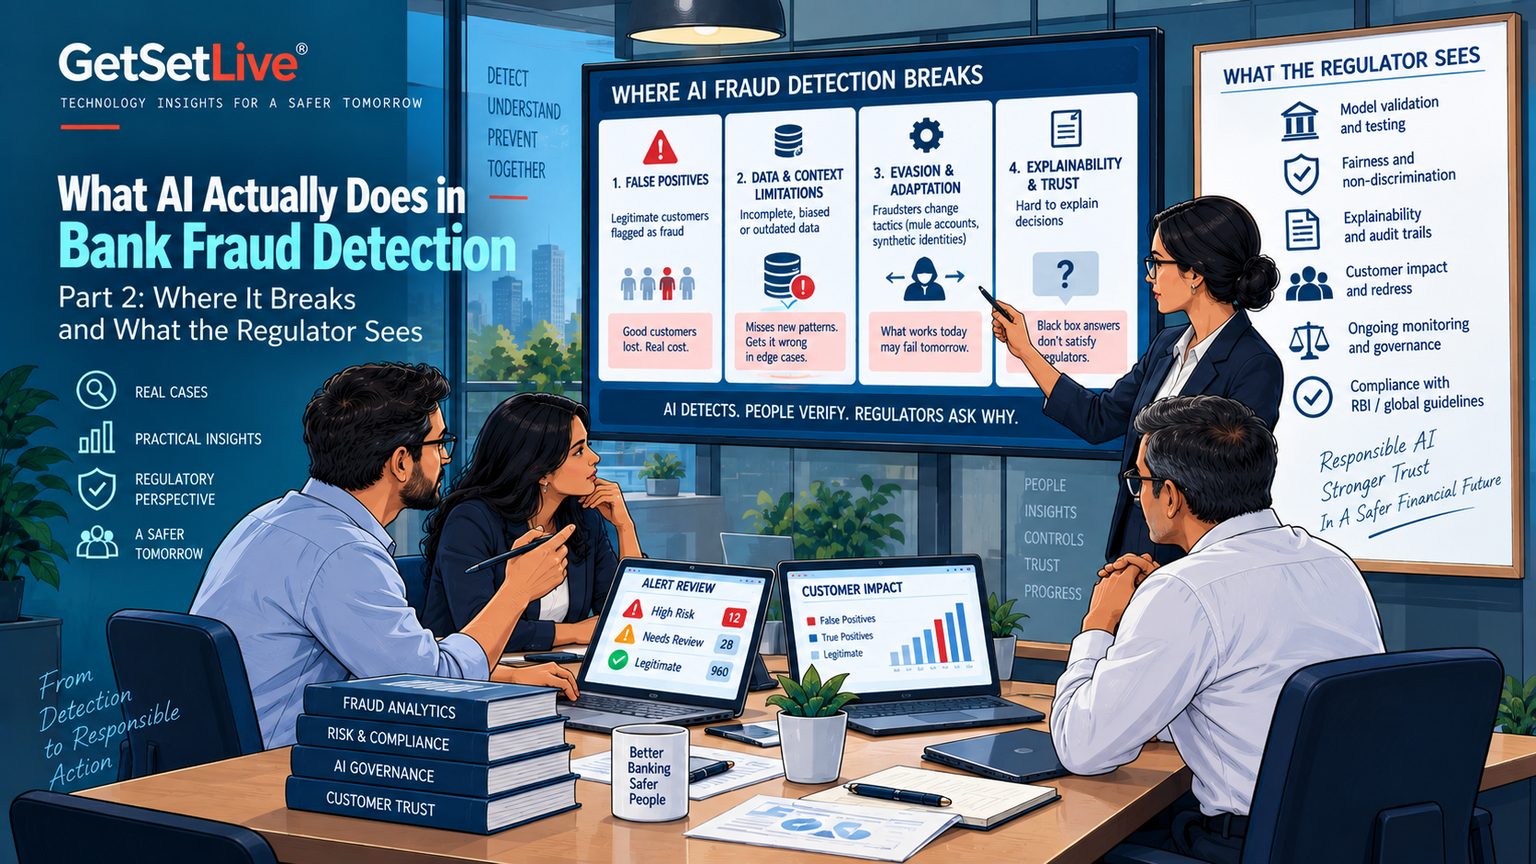
Part 2 of the bank fraud detection walkthrough. The numbers DBS, JPMorgan, HSBC, Danske and Standard Chartered actually publish, the brutal arithmetic of false positives on a 0.04% base rate, the four ways our stack still loses, what SR 11-7 and the EU AI Act ask of a fraud team, and what the senior analyst does all day.
In Part 1, I walked through the fraud stack we rebuilt with a mid-size US bank: Kafka, Flink, Tecton, the three-model ensemble, the Drools decision engine, the case management loop. Seventy-two millisecond median swipe-to-decision. Four hundred reviewable alerts a day instead of 18,000. On paper it looks like a solved problem. It is not. The bank had three production incidents in the 14 months after go-live that taught the fraud team more than the original build did, and the industry as a whole has spent four years learning that AI fraud detection fails in ways rules never did. This part goes through those failures, the numbers the big banks publish, the regulators who are now paying close attention, and what the senior analyst does with the cases the model hands back.

Key Takeaways
- Across every published bank case study, the biggest real win is analyst time saved; catching more fraud is usually third on the list.
- On a 0.04% fraud base rate, a “95% accurate” model still produces thousands of declined real customers a day, which is why step-up authentication exists.
- Our stack still loses four ways: first-party fraud, patient mule rings, synthetic identities, and adversarial probing of the decision boundary.
- SR 11-7 and the EU AI Act make the bank, not the model or the vendor, own every decision; the documentation burden is real and permanent.
What Is Inside
The Numbers Everyone Quotes
Every fraud vendor deck I have sat through in the last three years quotes some subset of the same five case studies. Before we set our own targets at the bank, I went through each one with the head of fraud operations to work out what it measured. Each tells you something different about what AI does at scale, and none of them says quite what the slide implies.
Free to use, share it in your presentations, blogs, or learning materials.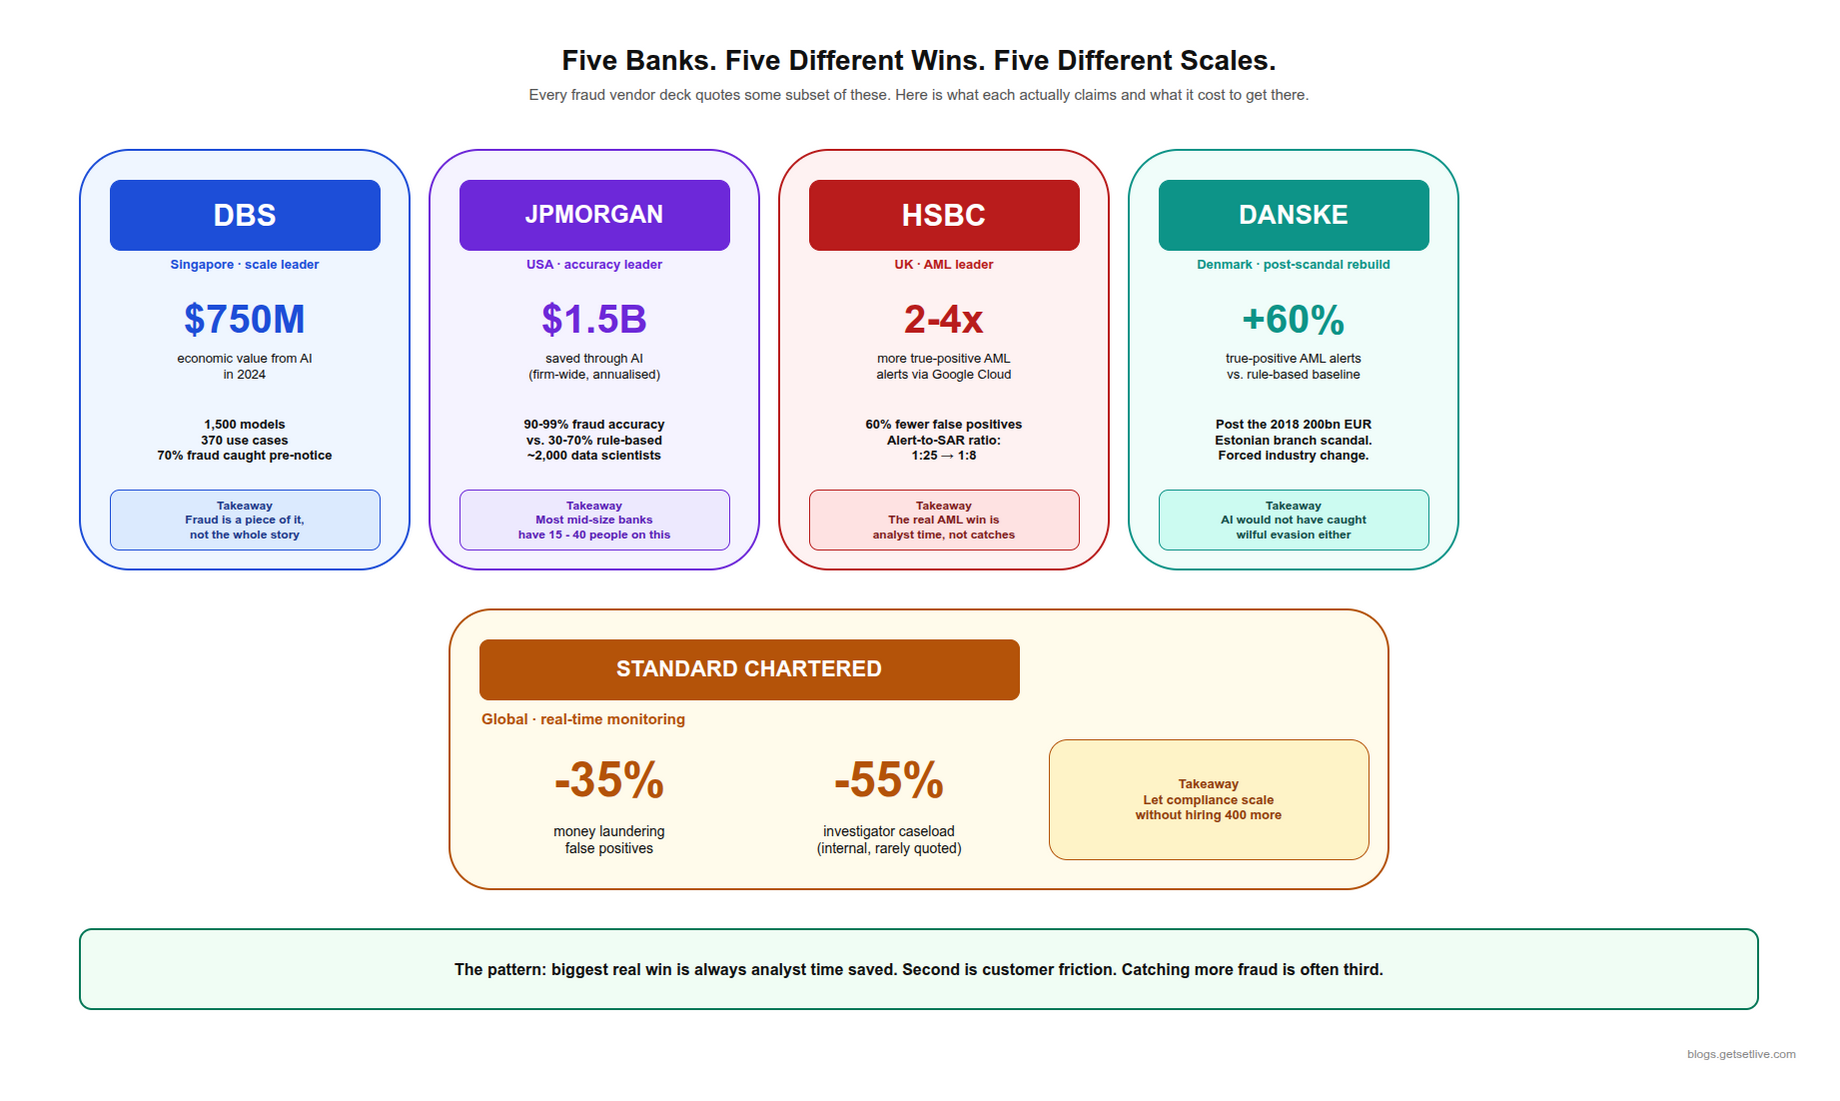
DBS Bank, Singapore
DBS is the AI bank every board member wants their bank to be. The number that gets quoted is 750 million dollars of economic value from AI in 2024, across 1,500 models on 370 use cases. Fraud is a real piece of that, but nowhere near all of it. What matters about DBS is breadth: churn prediction, product recommendation, transaction monitoring, AML, and dozens of internal workflows all run on the same platform. For fraud specifically, DBS reports catching around 70% of attempted fraud before the customer notices, against a pre-AI benchmark under 40%. That 70% is the number we borrowed as our own target, and we hit 64% in the first year.
JPMorgan Chase
JPMorgan’s most-quoted number is 1.5 billion dollars saved through AI across the firm. It is a yearly, firm-wide figure, not a fraud figure. The fraud claim is 90 to 99% accuracy against 30 to 70% for rule-based systems, and the lower figure is closer to false-positive-adjusted accuracy than to raw detection. Both numbers are real and come from their own research group. What the slides leave out is that JPMorgan has a data science organisation of roughly 2,000 people. The bank I worked with had 22. Copying JPMorgan with a 22-person team is not a plan. The honest version of that comparison is what we put in front of the board, and it set expectations that the project could meet.
HSBC with Google Cloud AML AI
HSBC runs Google’s AML AI platform on top of its own models. The headline: two to four times more true positives than legacy AML monitoring, and 60% fewer false positives. For an AML team that is the number that matters, because AML everywhere is drowning in false positives. Before AI a typical global bank’s alert-to-SAR ratio was around 1 in 25. After, it moves to roughly 1 in 8. The transformation is almost entirely analyst time, not fraud caught, and that turned out to be exactly our experience with SAR drafting in Part 1.
Danske Bank
Danske is the cautionary tale that forced the industry to take AML AI seriously. After the 2018 scandal, in which roughly 200 billion euros of suspicious transactions flowed through the Estonian branch, Danske rebuilt AML monitoring on machine learning and reported 60% more true-positive alerts than the old rules. The part I always add when this slide comes up: the new AI would not have caught the Estonian scandal retroactively. It could not have. That scandal ran on wilful evasion of controls, not on weak detection, and no architecture fixes a bank that has decided not to look.
Standard Chartered
Standard Chartered built real-time transaction monitoring that raises near-instant alerts on suspicious activity. Its public claim is a 35% cut in money-laundering false positives with true-positive detection up. The number it rarely quotes in public, and the one that matters, is that the real-time system cut investigator caseload by 55%. That is what let the compliance organisation scale without hiring another 400 analysts.
The pattern across all five: the biggest real win is always analyst time saved. The second is fewer customers declined. Catching more fraud is usually third, and sometimes last. Our own first-year scorecard came out in exactly that order, and the head of fraud operations was not surprised.
The False Positive Economics
I want to spend a section on this because it is the most underappreciated piece of the puzzle, and because it took me an embarrassing afternoon with a spreadsheet to feel it properly. A fraud model with 95% accuracy sounds excellent. Now run the numbers. The bank processes about 2.4 million card authorisations a day. The true fraud rate is around 0.04%, so 960 genuinely fraudulent transactions a day. A 95% accurate classifier on a 0.04% base rate produces something counterintuitive.
Ninety-five percent recall means catching 912 of the 960 and missing 48. Ninety-five percent precision would mean only 5% of flagged transactions are false positives, so flagging about 1,000 to catch those 912. But you cannot get 95% precision on a 0.04% base rate without an extraordinarily selective filter. More realistically, at 95% recall the model flags around 5,000 transactions to catch 912, which leaves 4,088 false positives. Every one of those is a real person having a card declined at a checkout. The first time I put that 4,088 on a slide, the room went quiet.
This arithmetic is why step-up authentication, covered in Part 1, is worth more than any accuracy gain. Instead of blocking the ambiguous 4,000, the bank pushes a confirm-this-transaction notification to the customer’s phone. The real customer taps yes and finishes the purchase; the fraudster cannot, because they do not have the phone. Step-up keeps the customer experience and still filters fraud, and it only exists because the model outputs a probability rather than a boolean.
The head of fraud operations keeps a rule of thumb that I have since stolen for other clients. Every percentage point of precision gained on the fraud model saves roughly 24 customer complaints a day and about 14,000 dollars a month in call-centre handling. Every half a point of recall gained prevents about 35,000 dollars a month in fraud loss. The two curves pull in opposite directions. Running a fraud team is the art of trading one against the other every quarter, based on the bank’s risk posture and what the complaint queue is saying.
Four Ways Our Stack Still Loses
This is the section that gets cut from every vendor pitch, and the reason I wanted to write the series at all. The diagram below shows the four categories where the stack still loses money. Each has a real incident behind it, at the bank or in the public record.
Free to use, share it in your presentations, blogs, or learning materials.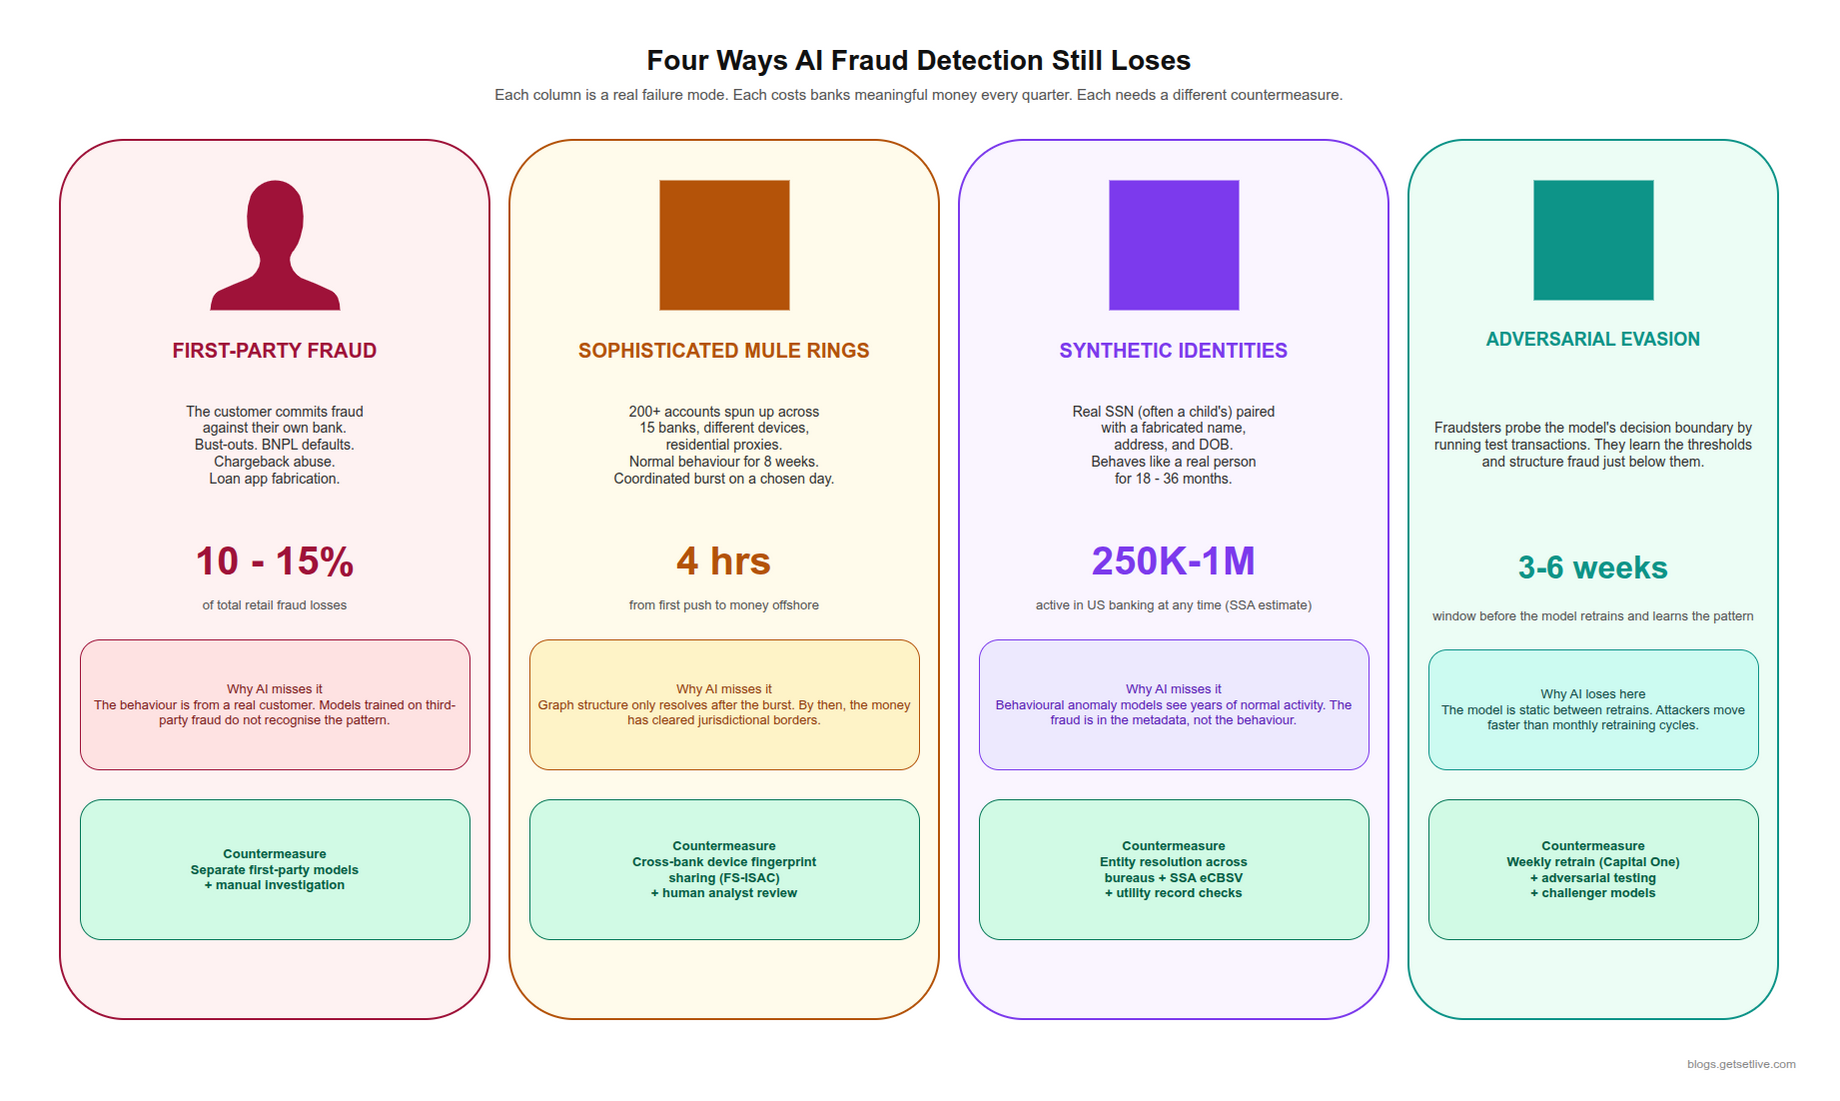
1. First-Party Fraud
First-party fraud is the customer committing fraud against their own bank. Buy-now-pay-later plans that were never going to be paid. Chargeback abuse on a legitimate purchase. Loan applications with a fabricated income. Bust-out schemes where a customer builds credit for 18 months, maxes every line in one week, and disappears. The industry estimate is that first-party fraud is 10 to 15% of retail banking fraud losses, and models trained on third-party signals do not catch it. The behaviour looks like a legitimate customer because it comes from a legitimate customer, who happens to be the fraudster. Our first year confirmed it: the ensemble’s recall on confirmed first-party cases was 31%, against 89% on third-party fraud. The bank still runs manual investigations for this class, and so does everyone else I have compared notes with.
2. Patient Mule Rings
GraphSAGE catches clumsy mule rings well. The good ones are built to beat graph detection. A modern operation spins up 200 fresh accounts across 15 banks with different device fingerprints, residential-proxy IPs, and different beneficiaries, then behaves perfectly for eight weeks: coffee, salary credits from shell companies, utility bills. On one coordinated day all 200 accounts receive wires and push the money out through P2P apps in under four hours. By the time the graph sees the ring structure, the money has crossed a border. The bank caught one such operation in Q2 2025, and not because of the model. A senior analyst noticed that 14 of the accounts had been opened with the same browser fingerprint in the same week. No model flagged it. A person did, and the fix that followed (a feature for shared onboarding fingerprints) came from that analyst, not from us.
3. Synthetic Identities
A synthetic identity pairs real data (a legitimate Social Security number, often a child’s) with a different name, address, and date of birth, then behaves like a real person for years before the fraud happens. Estimates put 250,000 to a million active synthetic identities in the US banking system at any time. Behaviour models miss them, because for 18 to 36 months they act like model citizens: slow credit building, on-time payments. The signal is in the metadata. An SSN issued in the year the “person” was supposedly 14. An address history that matches nobody who ever lived there. That is an entity-resolution problem, not an anomaly problem, and the architecture for it is different from the real-time pipeline. We built it as a separate batch job that runs nightly, and it is the least glamorous and most effective thing in the whole programme.
4. Adversarial Evasion
Fraudsters adapt. Once a ring learns that transactions under 500 dollars at merchant category 5411 (grocery) score low, they structure their fraud to stay there. That is not new, but a model amplifies it, because it learns whatever regularity is in the data and a ring can probe the decision boundary by running test transactions and watching which ones get flagged. We watched exactly this happen in month three of production: a cluster of 60-dollar grocery purchases across 300 cards, each one individually boring. The countermeasure is refresh frequency. The bank retrains monthly. That gives a serious ring a three-to-six-week window before the model learns its pattern. Some banks, Capital One among them, now retrain on seven-day windows. The cost is compute and model-stability risk, and we have not gone there yet.
What Our Three Incidents Taught Us
Part 1 promised the production incidents, so here they are, in the order they hurt. The first was in month three: the grocery-probe cluster described above. Three hundred cards, 60-dollar purchases at merchant category 5411, each one scoring 0.2. The ensemble was doing exactly what it had been trained to do. What caught it was a boring aggregate: a daily report of approved-transaction counts by merchant category and card-issue month, which showed a spike in one cell that made no sense. We added that report to the Wednesday review and it has since caught two more probes.
The second was in month seven, the Flink replay. A checkpoint failure during a deploy replayed 40 minutes of the card-auth topic, so every “count in the last 10 minutes” feature roughly doubled for 25 minutes. Scores rose across the board, the step-up rate tripled, and about 900 customers got a confirmation push they should not have. The customer-care queue noticed before our dashboards did, which was the embarrassing part. The fix had two halves: idempotent state updates keyed on the authorisation ID, and a feature-distribution monitor that compares each hour’s feature histograms against the trailing week and pages the on-call engineer when six or more features shift at once. That monitor has fired for real three times since, twice for upstream schema changes and once for a genuine attack.
The third was the mule ring in Q2 2025, and it was not a system failure so much as a system limit. Two hundred accounts across 15 banks, eight weeks of perfect behaviour, four hours of exit. The graph model saw nothing until the money moved, because there was nothing to see. What saved a slice of it was one analyst noticing a shared browser fingerprint across 14 onboardings in one week, and the feature we built from that observation now runs on every new account. Every one of the three fixes was a rule, a report, or a feature. Not one was a better model. That is the honest summary of a year in production.
The Regulators Are Watching
Any bank running AI for a decision that touches a customer is inside a growing regulatory perimeter. Two frameworks matter most, and a third agency has made its position clear without writing a rule.
SR 11-7 is the US Federal Reserve’s model risk management guidance, first issued in 2011 and treated as the reference point for every US bank running models in production. It asks for formal validation, written assumptions, an independent challenger model, and ongoing monitoring. Every AI fraud model at a US bank needs a validation package a regulator can examine on 48 hours’ notice. The bank’s data science team spends about 15% of every quarter on model documentation, and the first time the examiners asked for the challenger-model comparison, we had it only because the shadow-testing period had left the artefact behind. Not glamorous, not optional.
The EU AI Act, in force since 2024 and phasing in obligations through 2026, classifies credit scoring and fraud detection as high-risk AI systems. Banks operating in the EU must run conformity assessments, keep detailed technical documentation, publish transparency statements, and allow human oversight of any adverse decision. It has teeth: fines up to 35 million euros or 7% of global turnover, whichever is higher. Most EU banks restructured their AI governance in the last 18 months, and US banks with European operations followed.
FinCEN has not issued an AI rule, but it has been clear in public statements that using AI does not move regulatory liability. The bank owns the decision. The model is a tool. If the model misses a mandatory SAR, the bank is on the hook, not the vendor. That one sentence is why our compliance head insisted on reading every LLM-drafted SAR for the first month.
What the examination looked like in practice is worth a paragraph, because the guidance reads very differently from the meeting. The examiners asked for five things. The model card for each of the three production models, with owner, features, retrain date, and known limits. A random sample of ten blocked transactions with the reason codes an analyst would see. The champion-versus-challenger comparison from the last promotion. The override log: who overruled the model, when, why, and what happened 90 days later. And the false-positive trend by customer segment for the last six months. We had four of the five on the day. The override log existed only as free-text notes in Actimize, and turning it into a queryable table took a fortnight and a finding. Everything they asked was about process around the model. Nobody asked about the math.
One more thing the examination changed. The autoencoder, which had no per-decision explanation, became a documented “signal only” input: it can raise a score into the step-up band but can never on its own push a transaction into a block. That constraint lives in the Drools rules, not in the model, and it is the kind of design decision that only shows up once a regulator is in the room.
What the Analyst Still Does
I spent a full shift beside a senior fraud analyst, eight years in the job, to see what the work looks like now. The one-line summary I got: I look for the pattern the model has not seen yet. A model is great at what it was trained on and useless at what it was not. That day’s queue held 42 cases. Eighteen were step-up confirmed (the customer had already approved the push, no further action). Eleven were clear high-score blocks where her job was to document the case for audit. Nine were the interesting ones, scores between 0.65 and 0.82, and those got six to fifteen minutes each. Four were edge cases escalated to a supervisor. One was a fresh pattern nobody on the floor had seen, flagged to the data science team as a possible new feature.
Two phone calls happened that shift. One was to a customer in Oregon whose card was legitimately in Thailand, to confirm a 900-dollar hotel booking that had been flagged for step-up and not answered. The other was to an analyst at a partner bank, to coordinate on a suspected mule ring the two of them had spotted that week. Neither call is something the model does. Both mattered more than anything the model did that day.
The head of fraud operations does a different job again. Every Wednesday the week’s aggregates go on one screen: true positive rate, false positive rate, decision latency, complaint volume. A rising false positive rate triggers a tuning meeting. A new pattern triggers a feature engineering meeting. A tighter risk posture from the bank’s risk officer means tighter thresholds, and the head of fraud owns the customer friction that follows. That is the senior job, and no model does it.
What This Means for You as a Customer
A few observations for the reader who does not build these systems but meets one every time a card is swiped.
First, the decline at the grocery store is not always the bank being paranoid. Often it is a genuinely ambiguous transaction the model could not resolve, plus a policy that says decline when ambiguous. Call the bank, confirm the transaction, ask them to note the merchant. Most banks now offer real-time confirmation in the app, which is the same step-up flow described above. Turn it on.
Second, the “unusual activity” email is usually not AI detecting specific fraud on your account. It is the model saying this transaction was in the top 3% of unusualness for your history. If you recognise it, tap confirm. If you do not, dispute it. Either answer trains the model.
Third, if you have been a fraud victim, response time has genuinely improved. Before AI, the gap between the fraud happening and the bank noticing was four to nine days. Now it is often minutes, and that single change has done more for victims than any accuracy number. This is real, and it is the biggest customer benefit of the whole rebuild.
Fourth, if a legitimate purchase keeps getting blocked, build a pattern the model can learn. Use the card at the new merchant for small amounts first. Complete the step-up challenge when it comes. Let the bank see normal behaviour. Models learn from patterns; the fastest way to stop being flagged is to give the model a pattern to learn.
What Comes Next
That closes the banking pair. Next in the series is insurance, where the problem is different: claims are not real-time, but the computer vision on car damage photos runs faster than any adjuster can drive to a parking lot, and the model choices lean on CNNs and YOLO-family detectors that never appear in a banking stack. Same approach: a real insurer we worked with, the architecture, the models, then the failures. The insurance walkthrough starts here.
Related Reading
References
- Emburse, AI Fraud Detection in Banking 2026 Guide
- Sumsub, How AI Is Changing AML and Compliance, 2026
- US Federal Reserve, SR 11-7 Model Risk Management Guidance
- European Commission, EU AI Act Regulatory Framework
- FinCEN, FinCEN News Releases
Frequently Asked Questions
Fraud base rates are tiny, around 0.04% of transactions, so even a 99% accurate classifier produces thousands of false positives a day at bank scale. Step-up authentication (push notification, OTP, biometric) is the industry’s answer, because it filters fraud without declining legitimate purchases.
Poorly. First-party fraud is committed by the account holder, so the behaviour looks legitimate right up to the fraud event. Models trained on third-party patterns miss it. Most banks still use manual investigation and separate first-party models rather than the main fraud classifier.
SR 11-7 is the US Federal Reserve’s model risk management guidance. It requires banks to document model assumptions, maintain challenger models, and validate performance independently. It applies to every model used for a decision that affects customers, fraud detection included.
Yes. The EU AI Act classifies credit scoring and fraud detection as high-risk AI. Banks operating in the EU must run conformity assessments, keep technical documentation, and allow human oversight on adverse decisions. Fines can reach 35 million euros or 7% of global turnover.
By probing the decision boundary with test transactions and then structuring fraud to stay under the thresholds they discover, such as small grocery purchases spread across many cards. The defence is retraining frequency: monthly at most banks, weekly at a few, so the learned pattern closes the window faster than the ring can exploit it.
Because for 18 to 36 months a synthetic identity behaves like a model customer. The signal lives in metadata, such as a Social Security number issued in the wrong year or an address history nobody matches, so it is an entity-resolution job run in batch, not a real-time anomaly score.
No. Analysts handle the ambiguous cases, phone customers, coordinate across banks on fraud rings, and spot fresh patterns the model has never seen. At the bank in this series, about 400 cases a day still reach analysts; AI filtered out the other 17,600.