
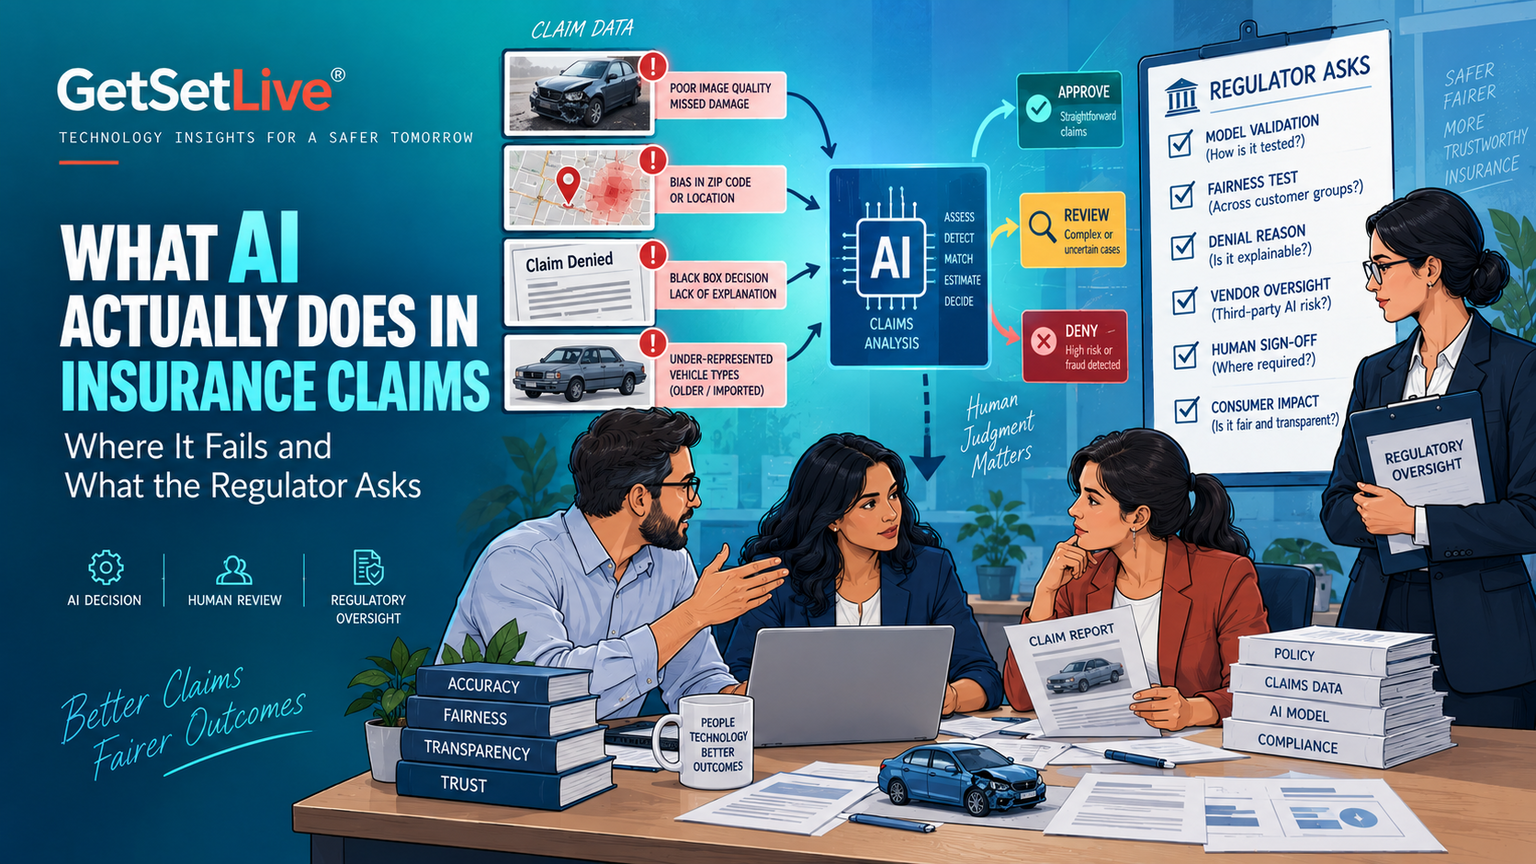
How the AI claims engine we rebuilt with a mid-size insurer actually works: the legacy flow, the six-lane architecture, which model does which job, and a walkthrough of one fender-bender from photo upload to payout in seven minutes.
Insurance is the domain where the gap between what AI marketing says and what AI does is widest. The adverts say AI settles your claim. What it does is sort, estimate, route, and draft. Adjusters still sign. Underwriters still price. Regulators still approve the forms. I spent 14 months rebuilding the claims platform of a mid-size general insurer (a motor and home book, roughly 800,000 claims a year) with its claims and data teams. What really changed was speed. How fast the first decision lands. The number of photos one person can handle in a day. And the count of fraud patterns a claim is checked against in milliseconds. This article walks through that engine piece by piece. No sales deck. Part 2 covers where it fails and what the regulator asks.

Key Takeaways
- AI does not settle claims. It produces a repair estimate and a fraud score; a rules engine with human-set thresholds decides whether a claim auto-pays or goes to an adjuster.
- Claims are multi-modal (photos, documents, sensor streams, tabular data), so the stack runs nine model families, not one, with YOLO and ResNet doing the visible work.
- Straight-through processing on motor claims went from 12% to 71% at the insurer; a clean fender-bender now pays out in about seven minutes plus a day for the bank transfer.
- The pipeline is built to escalate: blurry photos, boundary severity scores, pre-existing damage, and any elevated fraud score all route to a human by design.
What Is Inside
- The eight-minute settlement, taken apart
- The claims flow the insurer had before
- The three places AI lives in an insurer
- Anatomy of the claims architecture
- Which model does which job
- One fender-bender, end to end
- What the first month in production looked like
- What happens when the photo is ambiguous
- What happens when the customer is not who they say
- What comes next
The Eight-Minute Settlement, Taken Apart
A customer uploads a photo of a dented car and gets a settlement offer eight minutes later. Most people assume AI decided the payout. It did not. A model produced a repair estimate from the photo. A rules engine compared that estimate with the policy’s cover and deductible. Because the estimate came in under the auto-payment threshold, the claim was approved without an adjuster. Had it come in higher, an adjuster would have taken it, and the adjuster would have authorised the payout. The head of claims set that threshold in a meeting I sat in. The argument over whether it should be 2,000 or 2,500 dollars took longer than any model decision we made.
What happened in those eight minutes. A YOLO-family detector found the damage regions in the photo. A ResNet classifier graded the severity. A parts-pricing lookup returned part and labour costs for that make and model. A fraud screen checked for a duplicate photo, odd EXIF data, and a reused claim pattern. Then the decision engine combined all of it into a route. Seven systems. One human policy. Zero adjusters, for that one class of claim. That is the real split, and it is the split the rest of this article fills in.
The Claims Flow the Insurer Had Before
When we started, a motor claim at the insurer went like this. The customer called a phone number, the First Notice of Loss (FNOL). A call-centre agent typed the details into a form. A file was created and routed to a regional claims office. A field adjuster drove out to inspect the damage. A body shop produced an estimate. A desk adjuster reviewed it, negotiated, and authorised payment. A straightforward motor claim took 10 to 21 days. Property took longer. Bodily injury often took months. I spent my first week listening to FNOL calls, and the phrase “we will get someone out to you” came up on every single one.
Free to use, share it in your presentations, blogs, or learning materials.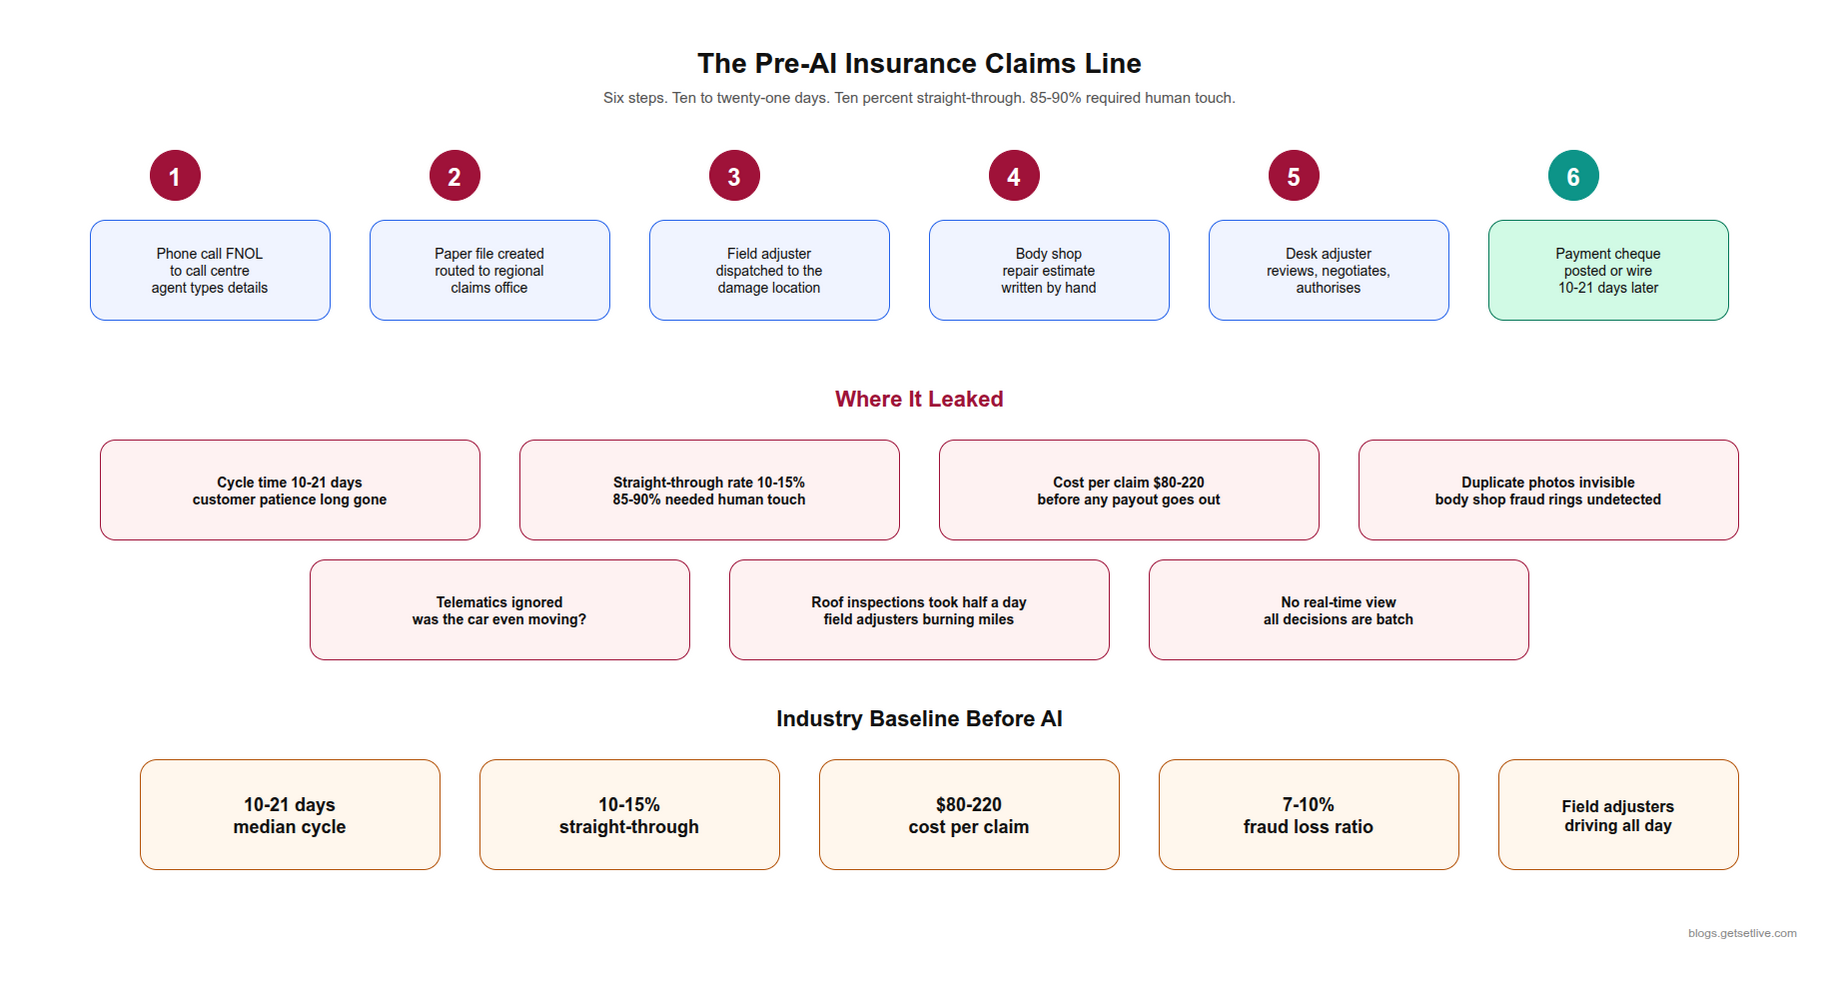
The old flow caught fraud at a rate well below the industry’s estimate of actual fraud. Its straight-through rate, the share of claims that closed with no human touch, was 12%, so 88% of claims needed at least one person. And it was expensive. The fully loaded cost of processing a motor claim ran between 80 and 220 dollars before any payout, which compounds quickly across 800,000 claims a year. Those three numbers, the fraud gap, the 12%, and the cost per claim, became the three targets on the programme’s first slide.
Some things the old flow simply could not do. Reading photos faster than an adjuster could drive to a parking lot. Comparing one claim’s photos with the other 3.4 million in the archive to catch a recycled image. Noticing that one body shop had sent in 47 claims in 30 days for the same make and model with the same damage. Checking telematics to see whether the car was even moving at the claimed time of loss. Every one of those became a lane in the new design.
The Three Places AI Lives in an Insurer
Before the architecture, it helps to see where AI has landed in the insurance value chain. There are three places, and they are three different stacks solving three different problems.
- Underwriting. Risk pricing at the point of quote. It takes bureau data, medical records for life and health, satellite images for roof condition and flood exposure, telematics for motor, and the usual actuarial factors. It produces a risk score and a suggested premium.
- Claims. Intake, triage, damage assessment, fraud screening, decisioning, and payment. This is the computer-vision-heavy part, and faster cycle times here are what the customer notices.
- Continuous underwriting. The shift from a policy priced once a year to a streaming risk view that updates as behaviour changes: telematics dongles, connected-home sensors, health wearables. Pricing moves at renewal, or mid-term, based on what the sensors saw.
This article is mostly about the claims stack, because it was most of our 14 months and it is the most AI-dense of the three. Part 2 covers the underwriting shift, continuous risk, and where the failures show up.
Anatomy of the Claims Architecture
The diagram below is the simplified version of the drawing that ended up on the claims floor. Six lanes, eleven components, left to right in the order a claim touches them. A straight-through motor claim runs the whole line in 7 to 14 minutes.
Free to use, share it in your presentations, blogs, or learning materials.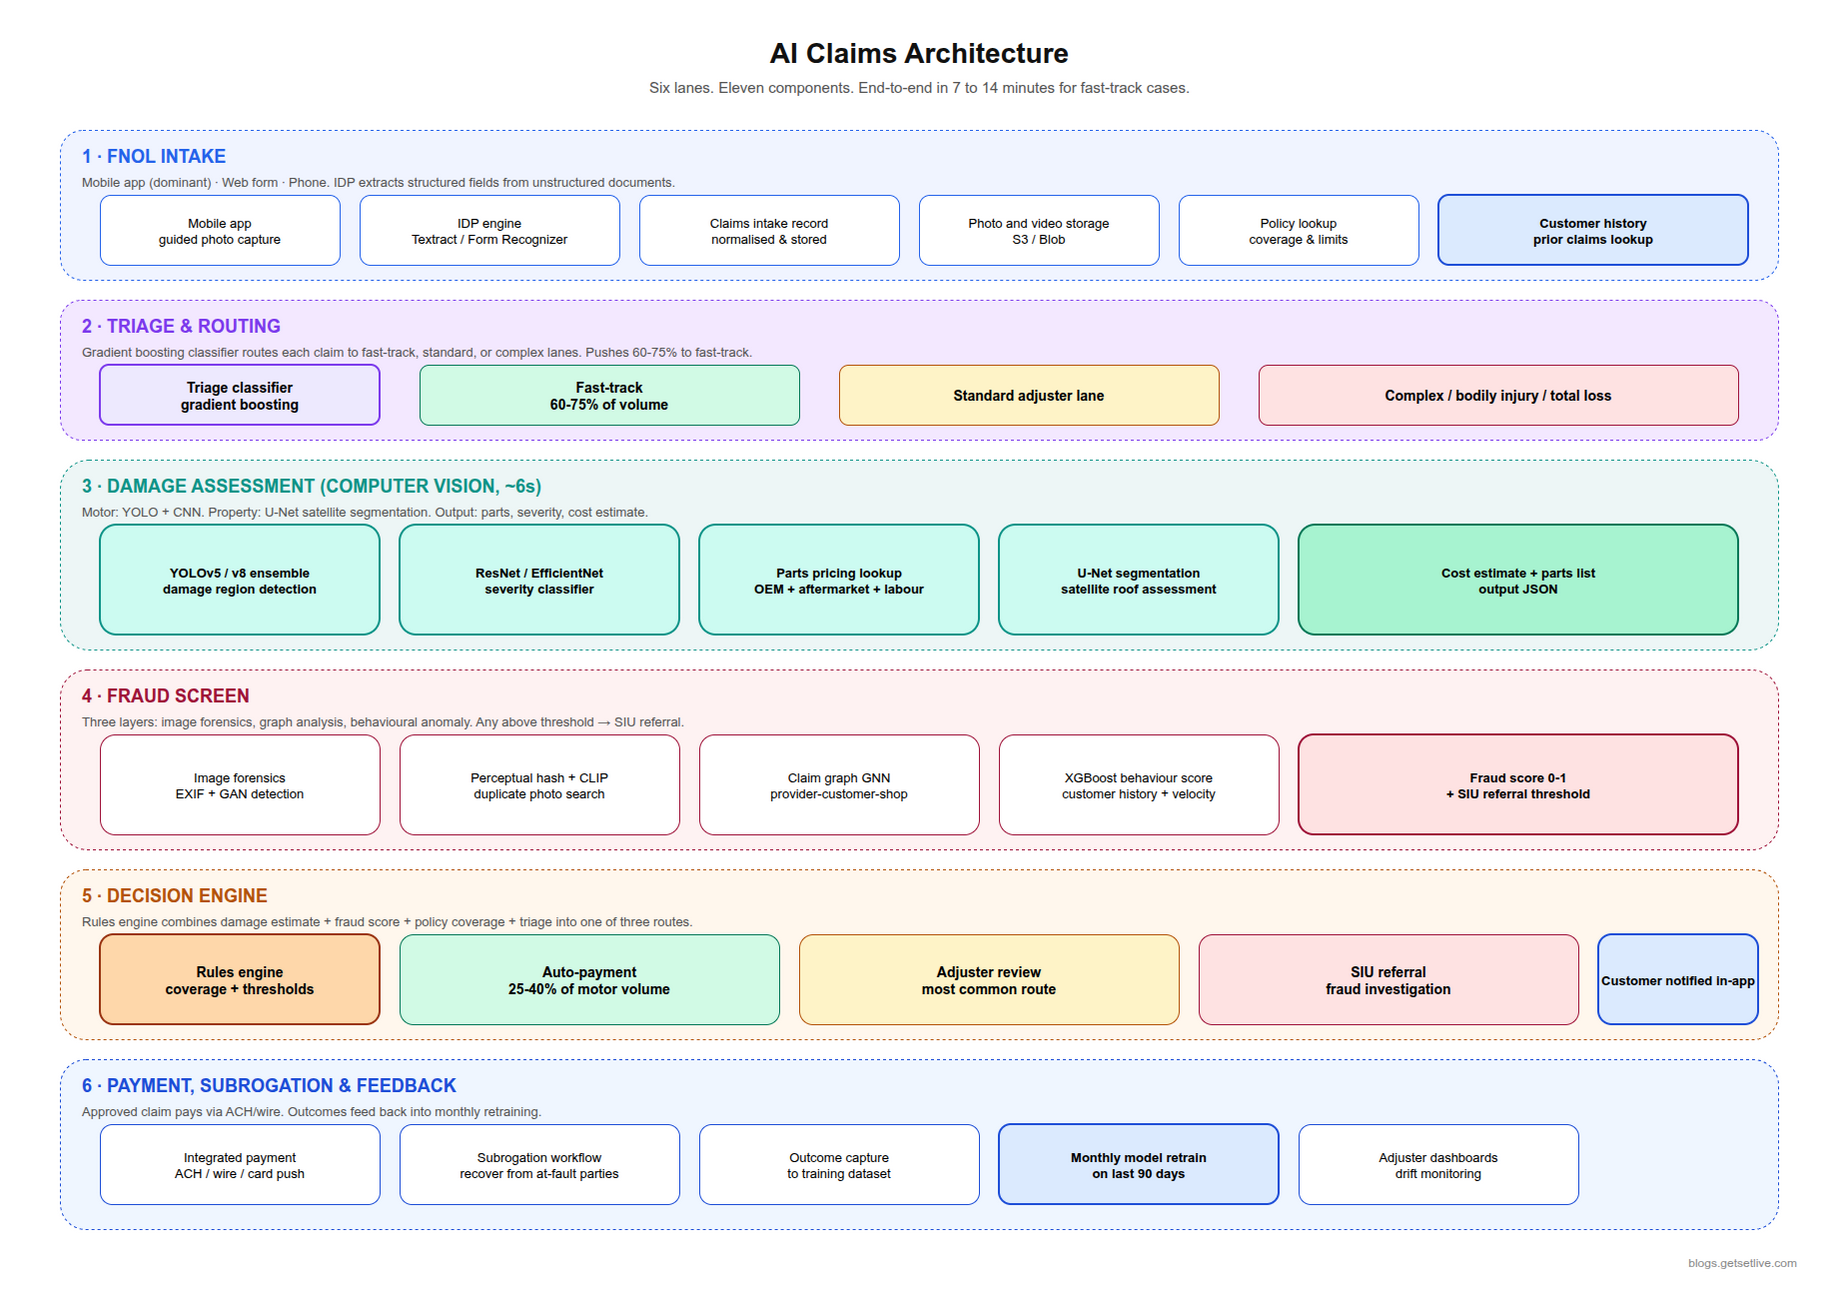
Lane 1: FNOL Intake
The claim starts when the customer files First Notice of Loss. The insurer now offers three paths: the mobile app (the dominant path for motor, 68% of volume within a year), a web form, and the phone. Whatever the channel, the intake layer turns the submission into one structured record and sends photos, videos, and documents to storage. This is also where document extraction runs, on AWS Textract in our case. It pulls fields out of police reports, repair estimates, and medical papers. Think of it as OCR that understands layout. The first version could not read a handwritten police report to save its life. The fix was routing anything with low extraction confidence to a human keyer, who still handles about 4% of documents.
Lane 2: Triage and Routing
A sorting model decides which lane the claim flows into. Fast-track is straight-through processing for simple, low-severity cases. Standard means a human adjuster. Complex covers bodily injury, total loss, suspected fraud, and anything above a value threshold. The triage model is gradient boosting on a small feature set: loss type, cover, rough severity, customer history. It does not need to be perfect. A wrong route gets fixed downstream. Its job is to push 60 to 75% of claims into fast-track, where the rest of the pipeline can handle them without a person.
Lane 3: Damage Assessment (Computer Vision)
This is the showpiece lane, and the one every vendor demo starts with. For motor claims, photos of the car flow into a computer vision pipeline: a YOLOv8 ensemble to find the damage regions, then a ResNet CNN to grade severity. The output is a list of parts (bumper, fender, headlight), a damage type per part (scratch, dent, crack, missing), a severity (minor, moderate, severe), and a repair-or-replace call. That feeds a parts-pricing lookup that returns OEM and aftermarket costs plus labour from the local body-shop network. The whole chain runs in under six seconds per claim.
What took us longest here had nothing to do with the models. It was the photo prompts in the app. The first version let customers take any photos they liked, and the detector’s confidence on that set averaged 0.61. Version three overlays an outline on the camera (“stand here, include the whole wheel arch”), and average confidence went to 0.87 with no change to the model. The single best computer-vision improvement in the whole programme was a user-interface change.
For property, a U-Net segmentation model grades roof condition from orbital imagery (EagleView and Nearmap feeds). It is less real-time, and it changed just as much. A roof inspection that used to cost a field adjuster half a day is now a desktop task measured in seconds. During the 2025 hail season it let the insurer sort 11,000 property claims in a week. That would have taken a quarter before.
Lane 4: Fraud Screen
Every claim runs through a fraud screen in parallel with damage assessment. The screen has three layers. Image forensics checks EXIF metadata for tampering, runs a CNN that spots GAN-generated or edited regions, and hashes every photo against the archive for duplicates. Claim-graph analysis runs a GNN over the provider-customer-body-shop-adjuster graph and flags claims that sit unusually close to known fraud clusters. Behavioural features (loss time against policy inception, loss value against customer history, claim velocity) feed a gradient-boosted classifier that produces the fraud score. Anything above threshold goes to the Special Investigations Unit, not to auto-payment.
The graph layer paid for itself in month nine. It found a cluster of 47 claims from one body shop, all the same make and model, all with the same damage. No single claim looked wrong. The shop had been submitting them for two years. The SIU confirmed the ring, the shop is out of the network, and that one find covered the cost of the whole fraud lane.
Lane 5: Decision Engine
The damage estimate, the fraud score, the cover check, and the triage result all land in a rules-based decision engine. It produces one of three routes. Auto-payment, as a direct deposit to the customer or a direct payment to the body shop within 24 hours. Adjuster review, the most common. Or SIU referral. Auto-payment thresholds vary by claim type. They cover 25 to 40% of motor claims by volume at the insurers I have compared notes with, and 34% at ours. The head of claims sets those thresholds, reviews them each quarter, and the model never touches them.
Lane 6: Payment, Subrogation, and Feedback
An approved claim triggers a payment over ACH, wire, or card push. Subrogation, recovering costs from at-fault parties or their insurers, runs as a separate, slower workflow. Adjuster decisions and final outcomes flow back into the training set, and the models retrain monthly. Without that loop they go stale within weeks. Body shops, repair costs, and fraud patterns all move.
Which Model Does Which Job
The insurer runs nine model families across claims and underwriting. That is more than the bank in the previous pair of articles, and more than the lender before that. The reason is the mix of data types. Banking fraud is almost entirely tabular. Claims involve photos, video, text, sensor streams, and tables. No one model family handles all of them well. Mixed inputs, mixed stack.
Free to use, share it in your presentations, blogs, or learning materials.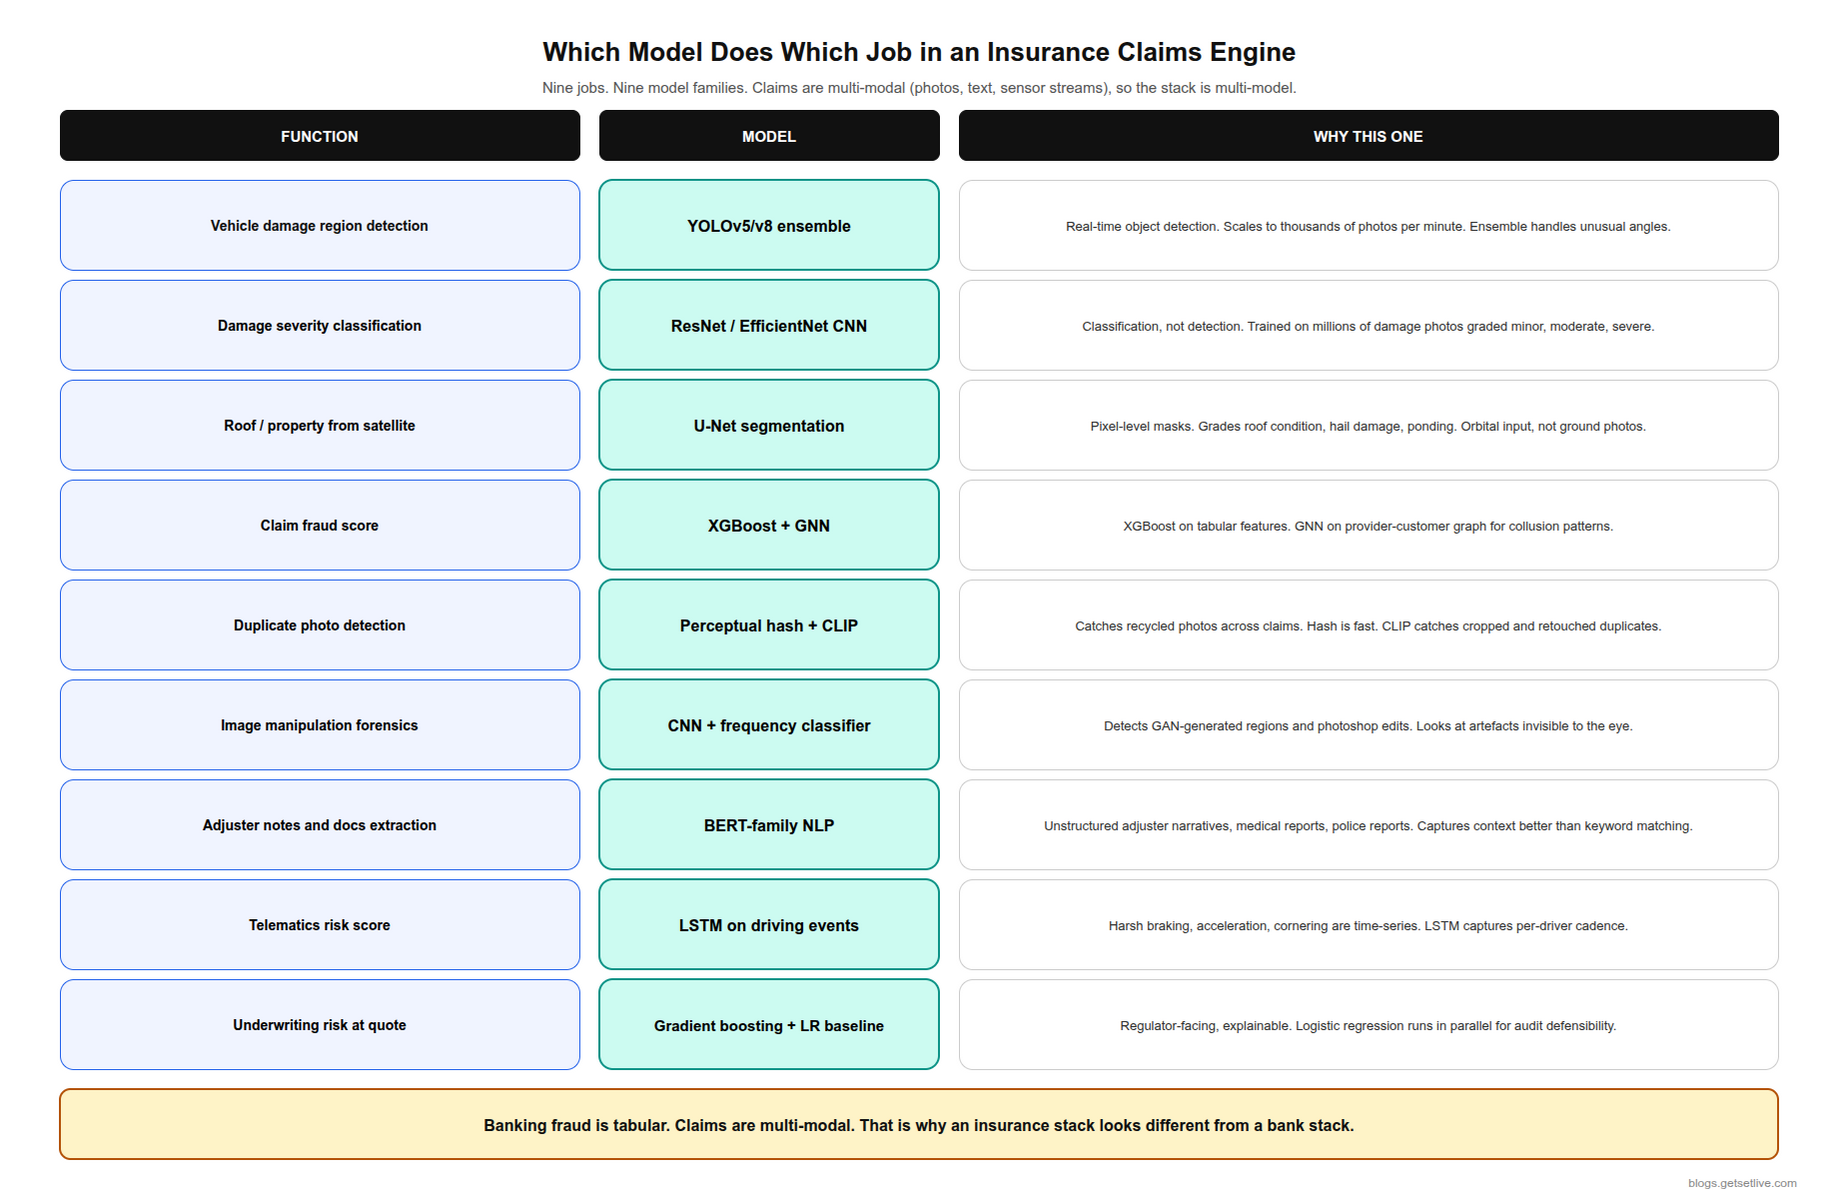
| Function | Model | Why this one |
|---|---|---|
| Vehicle damage region detection | YOLOv8 ensemble | Real-time object detection, thousands of photos a minute; the ensemble holds up on odd angles |
| Damage severity classification | ResNet CNN | Classification, not detection; trained on millions of labelled photos graded minor, moderate, severe |
| Roof and property from satellite | U-Net segmentation | Pixel-level masks for roof condition, hail damage, ponding; orbital input, not ground photos |
| Claim fraud score | XGBoost + GNN | XGBoost on tabular features; the GNN on the provider-customer graph catches collusion |
| Duplicate photo detection | Perceptual hash + CLIP embeddings | Hash is fast; CLIP catches cropped and retouched copies the hash misses |
| Image manipulation forensics | CNN + frequency-domain classifier | Finds GAN regions and edits through artefacts invisible to the eye |
| Adjuster notes extraction | BERT-family NLP | Adjuster narratives, medical and police reports; context beats keyword matching |
| Telematics risk score | LSTM on driving events | Braking, acceleration and cornering are time series; the LSTM learns each driver’s cadence |
| Underwriting risk at quote | Gradient boosting + logistic baseline | Regulator-facing and explainable; the logistic model runs in parallel for audit |
Two rows deserve a note. The CLIP embeddings for duplicate detection were a late addition, after the perceptual hash missed a claim that reused a photo cropped by 15%. And the logistic baseline for underwriting exists for the same reason it exists at the lender and the bank. When a state examiner asks how a price was set, someone has to explain every coefficient on a whiteboard.
One Fender-Bender, End to End
To make the architecture concrete, here is a real claim from the insurer’s logs, anonymised. A customer opens the app after a parking-lot bump on a Wednesday afternoon.
- T+0: The customer taps “File a Claim”, answers six guided questions, and takes eight photos with the outline prompts overlaid on the camera.
- T+2 min: Submission complete. Photos land in claims storage and a structured intake record is created.
- T+2 min 4 s: The triage model scores the claim: low severity, clear photos, no injury indicated. Routed to fast-track.
- T+2 min 10 s: YOLO finds two damage regions, front bumper (scratch, moderate) and right headlight (crack, moderate). ResNet confirms severity. Parts pricing returns a replacement bumper, a replacement headlight, and three hours of labour. Estimate: 1,840 dollars.
- T+2 min 12 s: The fraud screen runs in parallel. No EXIF tampering, no duplicate hashes, no graph flag, no manipulation signal. Fraud score 0.07.
- T+2 min 14 s: Decision engine: 1,840 dollars is below the 2,500 dollar auto-payment threshold. The policy carries a 500 dollar deductible and a 40,000 dollar cover limit. Cover valid, fraud score well under threshold. Route: auto-payment.
- T+7 min: In-app notification: approved for 1,340 dollars (estimate minus deductible), with a choice between direct payment to a preferred body shop or ACH to the customer.
- T+24 h: The ACH lands. Claim closed.
No human touched this claim. Seven systems did. A policy set the auto-payment threshold, and a fraud threshold decided there was nothing to escalate. The only reason it works is that the fast-track lane is tightly scoped: simple loss types, clear photos, modest amounts, clean history. Anything outside that envelope goes to an adjuster, and by value, if not by volume, that is still most of the book.
Straight-through processing on motor claims moved from 12% to 71% at the insurer in the first year, and the industry range at mature AI insurers is 70 to 90%. This is the biggest visible change in claims experience the industry has seen in 30 years, and the customers notice it before the board does.
What the First Month in Production Looked Like
Go-live was a Tuesday in March. We had run the pipeline in shadow for six weeks, scoring real claims beside the adjusters without acting on them, so the numbers were not a surprise. The behaviour of the people was. On day one, 41% of motor claims went straight through. By the end of week one, 58%. The adjusters had spent the shadow period expecting to lose work and found instead that their queue had changed shape. The clean claims were gone. What was left was harder, and it took two weeks for the floor to stop treating every auto-paid claim as something that needed a second look.
Day eleven gave us our first real incident. The parts-pricing vendor changed a field name in its feed overnight. Every estimate came back as zero dollars. A zero estimate is under every auto-payment threshold, so in theory the pipeline could have approved 300 claims for nothing. It did not, because the decision engine treats a zero estimate as invalid and routes the claim to an adjuster. That rule had been written in week three of the build by a claims manager who asked what happens if the pricing feed lies. Nobody on the engineering side had thought to ask. The safest rule in the whole engine came from the person who had spent 20 years watching claims go wrong.
By the end of the month the straight-through rate had settled at 66%. Cost per motor claim was down from 140 dollars to 52. The SIU had its first graph-generated referral. What I would do differently is start the photo-prompt work in month one instead of month six. The models were ready long before the photos were good enough to feed them.
What Happens When the Photo Is Ambiguous
The walkthrough above assumed a clean case. What if the photos are blurry, the damage could be pre-existing, or the severity sits between two classes? Here is what the pipeline does, and each of these rules exists because of a claim that went wrong in the first six months:
- A photo-quality detector runs first. If the CNN’s confidence on image quality drops below threshold, the app asks the customer to retake the shot. Garbage never reaches the damage model.
- Severity class boundary. If the model output sits between two classes (0.48 minor, 0.49 moderate), the claim does not auto-approve regardless of the amount. It goes to an adjuster.
- Pre-existing damage check. If the customer has claimed on the same vehicle before, current photos are compared against the old ones. Overlapping damage regions route the claim to SIU.
- Unusual angle or occluded view. If YOLO’s box confidence is low or the region is partly hidden, the app asks for one more photo with specific instructions.
The pipeline is built to escalate when confidence is low. That is the opposite of the common fear that AI will railroad bad decisions. A well-built claims pipeline is conservative by design, and route-to-human is the default whenever any component is unsure. The first version was not conservative enough, and the boundary-severity rule went in after an adjuster found a moderate dent paid out as minor.
What Happens When the Customer Is Not Who They Say
Identity fraud is the fastest-growing claims fraud category. The pipeline carries three defences. First, device fingerprinting at the app level: a fresh device with no prior session history filing a claim above a certain amount raises the fraud score automatically. Second, a liveness check during intake. If the claim needs identity proof, the app asks for a selfie with a live challenge (turn your head, blink, smile) and a CNN scores the capture. Third, cross-claim matching. The same bank account or mailing address on several unrelated claims inside 60 days raises an alert.
None of these is perfect. A determined operator can spoof all three. Together they raise the cost of an attempt enough that the amateur gives up and the professional ring moves on to an insurer with weaker defences. That is the real dynamic behind falling industry fraud loss, and it only works if enough insurers deploy the defences. When we switched the liveness check on, attempted identity fraud on the app dropped 44% in the first quarter. The SIU’s read was that the traffic had moved, not stopped.
What Comes Next
This article covered the architecture, the part that works. The next one covers what happens when it meets the real world. The numbers the industry quotes (Markel with Cytora, Tractable’s minutes-not-days, the 70 to 90% straight-through figures). Continuous underwriting through telematics and the privacy trade it forces. The NAIC model bulletin, redlining through zip-code proxies, and the four ways AI claims systems still fail. If this walkthrough was useful, the failure-modes article is the one that explains why insurers are hiring more AI governance staff than ever, not fewer. Part 2 is here.
Related Reading
References
- Accenture, Why AI in Insurance Claims and Underwriting
- Confluent, Accelerating Insurance Claims With Stream Processing
- Vantage Point, Insurtech Trends 2026: AI in Claims and Underwriting
- MDPI, Automated Car Damage Assessment Using Computer Vision
- NAIC, Artificial Intelligence in Insurance
Frequently Asked Questions
AI produces the damage estimate, the fraud score, and a recommended route. A rules engine, using thresholds set by claims operations leadership, authorises the settlement. For fast-track claims no adjuster touches the file; for everything else an adjuster reviews and signs.
Most insurers use a YOLO-family object detector (YOLOv5 or YOLOv8) to find the damage regions, followed by a ResNet or EfficientNet CNN to grade severity. The two run as a pipeline: YOLO finds the damage, the CNN grades it.
Computer vision and the fraud screen run in under 10 seconds per claim. End to end, from submission to approval, fast-track cases take 7 to 14 minutes. The payment itself lands in 24 to 48 hours by ACH.
Low-confidence cases route to a human adjuster automatically. Photo-quality detection, severity-boundary checks, pre-existing damage comparison, and unusual-angle flags all trigger route-to-human. The pipeline is built to be conservative when any component is unsure.
Because claims are multi-modal. Photos need detectors and CNNs, documents need NLP, telematics needs time-series models, and fraud needs graph and tabular models. No single model family handles all of those well, so a claims stack ends up with eight or nine of them.
A claim that closes with no human touch: intake, estimate, fraud screen, decision, and payment all automated. Mature AI insurers reach 70 to 90% on motor claims; the insurer in this article went from 12% to 71% in its first year.
For specific patterns, yes. Image forensics catches EXIF tampering and GAN edits, perceptual hashing and CLIP catch recycled photos, and graph neural networks catch provider-customer-shop collusion rings. Sophisticated fraud still needs human investigation, but the AI filter catches 60 to 80% of common attempts.