The biggest lesson Vikram learned during execution was that migration is not a single event. It is a series of controlled moves spread across months, each with its own cutover window, validation checklist, and rollback plan. His team migrated 38 workloads in 4 waves over 8 months. The first wave was 3 low-risk VMs. The last wave was the Oracle patient records database. Every wave taught them something that made the next wave smoother.
Migration Waves: Sequencing Workloads
Moving everything at once is a recipe for disaster. A single cutover of 38 VMs means 38 things that can fail simultaneously with no clear path to isolate which one broke. Wave-based migration moves workloads in groups of 3 to 8, validates each group, and only proceeds to the next wave after the previous one is stable for at least 2 weeks.
Vikram’s team organized their 38 VMs into 4 waves based on the risk scoring from Part 1.
Free to use, share it in your presentations, blogs, or learning materials.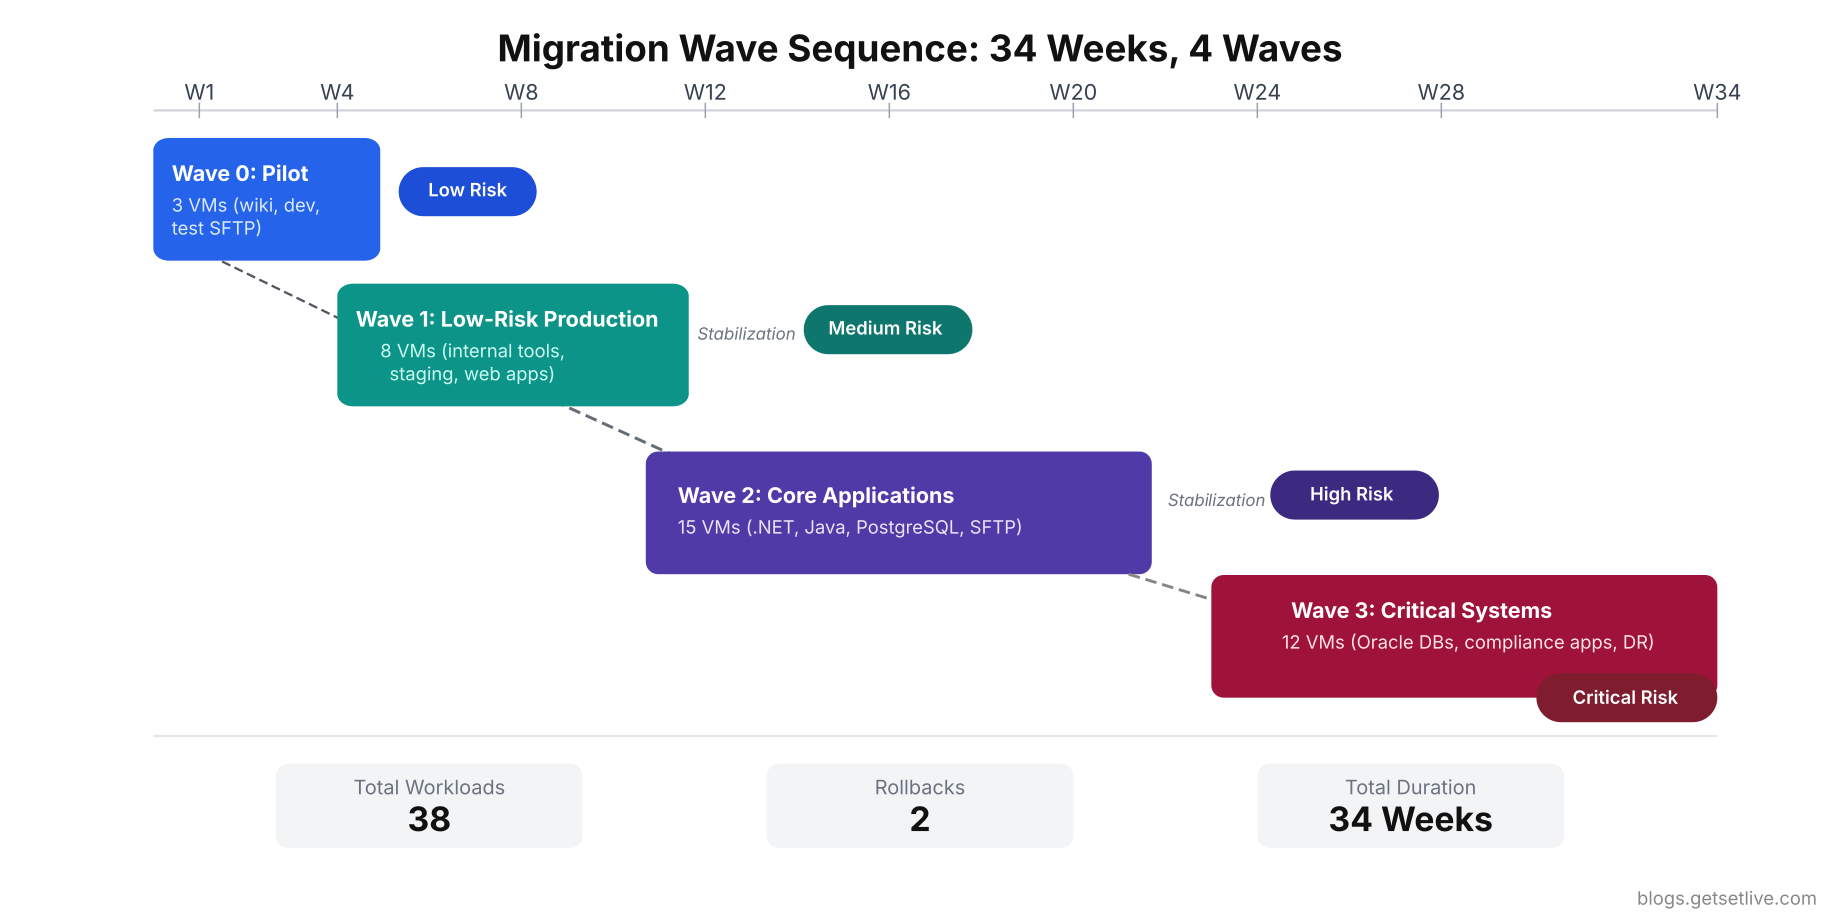
Wave 0: Pilot (Week 1 to Week 4)
Workloads: 3 non-critical VMs (internal wiki, development environment, test SFTP server)
Purpose: Validate the migration process itself. Test the VPN connectivity, verify the rsync pipeline, confirm that IAM roles and security groups work, and train the team on the cutover procedure. If the pilot fails, zero production impact.
Vikram’s pilot exposed 4 issues that would have been catastrophic in a production wave. The VPN tunnel dropped under sustained data transfer loads because the on-prem firewall’s IPsec throughput was capped at 250 Mbps. The rsync process choked on files with special characters in their names (the wiki had 340 files with parentheses and spaces). The development environment’s Java application used a hardcoded reference to the on-prem NTP server, which was not reachable through the VPN. And the security group rules blocked ICMP, which prevented the monitoring agent from detecting that the instance was alive.
# Test sustained throughput through the VPN tunnel
iperf3 -c 10.200.0.1 -t 300 -P 8 –logfile /opt/baseline/vpn_throughput_test.log

# Monitor VPN tunnel stability over 24 hours
$ ping -c 86400 -i 1 10.200.0.1 | awk ‘{print strftime(“%Y-%m-%d %H:%M:%S”), $0}’ > /opt/baseline/vpn_stability.log &
Wave 1: Low-Risk Production (Week 5 to Week 10)
Workloads: 8 VMs (4 internal tools, 2 staging environments, 2 low-traffic web applications)
Dependencies: Active Directory (still on-prem, accessed via VPN), internal DNS forwarder (replicated to Route 53 private zone), NFS file share (replaced with EFS mount).
This wave was the first to involve production workloads with real users. Vikram scheduled each cutover for Friday night at 11 PM, giving the team the entire weekend to monitor and fix issues before Monday morning traffic. The two web applications required DNS changes (Route 53 public zone updates), which propagated within 15 minutes because the team had lowered TTL to 300 seconds two days before cutover.
The biggest surprise in Wave 1 was file permissions. The internal tools stored user-uploaded documents on NFS shares. After migrating to EFS, the file ownership changed because the UID/GID mapping between the on-prem Linux servers and the EC2 instances was different. Every uploaded file returned “Permission denied” for 3 hours until Vikram’s team remapped the UIDs using the EFS access point configuration.
Wave 2: Core Applications (Week 12 to Week 22)
Workloads: 15 VMs (6 .NET applications, 4 Java microservices, PostgreSQL analytics cluster, SFTP gateway, 4 supporting services)
This was the longest wave because it contained the most interdependent workloads. The Java microservices called the .NET applications via REST APIs. The .NET applications queried the PostgreSQL cluster. The SFTP gateway authenticated against Active Directory and wrote files to a staging directory that a cron job picked up and loaded into PostgreSQL.
The migration order within a wave matters as much as the wave sequencing itself. Vikram migrated the PostgreSQL cluster first, then the .NET applications, then the Java microservices, and finally the SFTP gateway. Each step moved the dependency chain from on-prem to cloud, reducing cross-environment calls. Migrating in the reverse order would have forced every application to make cross-VPN database calls, adding 8ms of latency to every query.
1# Track latency to on-prem services from cloud (run from EC2 instance)
2while true; do
3  TIMESTAMP=$(date +%Y-%m-%dT%H:%M:%S)
4  DB_LATENCY=$(curl -o /dev/null -s -w ‘%{time_connect}’ http://10.100.5.20:5432 2>/dev/null || echo “timeout”)
5  AD_LATENCY=$(curl -o /dev/null -s -w ‘%{time_connect}’ ldap://10.100.2.10:389 2>/dev/null || echo “timeout”)
6  echo “$TIMESTAMP db=$DB_LATENCY ad=$AD_LATENCY”
7  sleep 60
8done >> /opt/monitoring/cross-env-latency.log &
The PostgreSQL migration used logical replication to keep the cloud replica in sync with on-prem during the transition. The replication lag averaged 1.2 seconds during business hours. On cutover night, Vikram’s team stopped the replication, promoted the cloud replica to primary, and updated all application connection strings via AWS Systems Manager Parameter Store. The entire PostgreSQL cutover took 22 minutes with zero data loss.
$ psql -h cloud-replica.region.rds.amazonaws.com -U repl_monitor -d meridian_analytics -c ”SELECT
  slot_name,
  pg_size_pretty(pg_wal_lsn_diff(pg_current_wal_lsn(), confirmed_flush_lsn)) AS replication_lag,
  active
FROM pg_replication_slots;”
slot_name    | replication_lag | active
————–+—————–+——–
 cloud_replica | 824 kB         | t
Wave 3: High-Risk Critical Systems (Week 24 to Week 34)
Workloads: 12 VMs (Oracle patient records database, Oracle billing database, 4 compliance-sensitive applications, disaster recovery infrastructure, backup systems, monitoring stack)
Free to use, share it in your presentations, blogs, or learning materials.
This was the wave Vikram’s team had been dreading. The Oracle databases contained ePHI for 4.2 million patients. Any data loss or extended downtime would trigger regulatory reporting requirements. The compliance applications had specific audit logging needs that had to be verified in the cloud before cutover.
Vikram’s team ran a full dress rehearsal 2 weeks before the actual cutover. They restored the Oracle databases to a separate set of RDS instances, connected the compliance applications to them, and ran the complete validation suite. The dress rehearsal found 3 issues: an Oracle stored procedure that used a feature not available in RDS (dbms_scheduler with OS authentication), a compliance application that validated the server hostname and rejected the RDS endpoint format, and an audit log export that wrote to a local /var/log directory that did not persist on EBS after instance restart.
All three issues were fixed before the real cutover. Without the dress rehearsal, they would have been discovered at 2 AM on migration night with a production database in an inconsistent state.
For any workload classified as high-risk, run a full dress rehearsal in a separate cloud environment at least 2 weeks before the actual cutover. Use production-sized data. Test every application, every integration, every batch job. The cost of a dress rehearsal is a few hundred dollars in temporary cloud resources. The cost of discovering issues during live cutover is measured in downtime, data loss, and regulatory consequences.
The Cutover Process
Every cutover followed the same 7-step process. Vikram printed it on laminated cards for each team member. At 2 AM on migration night, nobody remembers procedures from a training session two months ago.
- Step 1: Final data sync. Run the last rsync/replication cycle to bring the cloud copy within minutes of the on-prem source. Verify replication lag is under the acceptable threshold (Vikram set it at 5 minutes for apps, 60 seconds for databases).
- Step 2: Stop writes on source. Put the on-prem application in maintenance mode or stop the source database from accepting writes. This creates a clean cutoff point. For Vikram’s Oracle databases, this meant setting the tablespace to READ ONLY mode.
- Step 3: Final catch-up sync. Run one last replication cycle to capture any writes that occurred between Step 1 and Step 2. Verify zero replication lag.
- Step 4: Promote cloud replica. Switch the cloud database from replica to primary. Update application connection strings to point to the cloud endpoint.
- Step 5: Update DNS and routing. Change DNS records, load balancer targets, or API gateway routes to point to the cloud instances. If using Route 53, weighted routing can shift 10% of traffic first as a canary.
- Step 6: Run validation suite. Execute the full validation checklist within 30 minutes of cutover. If any critical check fails, execute rollback immediately.
- Step 7: Monitor for 4 hours. Keep the entire team online for 4 hours post-cutover watching dashboards, error rates, and application logs. If no critical issues surface in 4 hours, declare the wave successful.
 1#!/bin/bash
 2echo “=== Post-Cutover Validation $(date) ===”
 3
 4# 1. Check all application health endpoints
 5for app in app1.meridian.cloud app2.meridian.cloud api.meridian.cloud; do
 6  STATUS=$(curl -o /dev/null -s -w ‘%{http_code}’ https://$app/health)
 7  echo “[$STATUS] $app”
 8done
 9
10# 2. Verify database connectivity
11psql -h analytics.cluster.rds.amazonaws.com -U app_user -d meridian -c “SELECT count(*) FROM patients;” -t
12
13# 3. Check SSL certificate validity
14echo | openssl s_client -servername app1.meridian.cloud -connect app1.meridian.cloud:443 2>/dev/null | openssl x509 -noout -dates
15
16# 4. Verify DNS resolution from external
17dig app1.meridian.cloud A +short @8.8.8.8
18
19# 5. Check error rate in application logs (last 15 minutes)
20aws logs filter-log-events –log-group-name /meridian/app1 –start-time $(date -d ’15 minutes ago’ +%s000) –filter-pattern “ERROR” –query ‘events[*].message’ –output text | wc -l
21
22# 6. Check CloudWatch alarms
23aws cloudwatch describe-alarms –state-value ALARM –query ‘MetricAlarms[*].AlarmName’ –output table
Rollback Decision Framework
Every wave needs a rollback plan that the team can execute without thinking. At 3 AM after a failed cutover, decision fatigue is real. Vikram defined three categories of issues with pre-determined responses.
Category 1: Immediate rollback (within 30 minutes). Data corruption detected, database fails integrity checks, compliance-critical application cannot access audit logs, application returns 500 errors on core workflows. For these, the team reverts DNS, restarts the on-prem application, and re-enables writes on the source database. Total rollback time: 15 to 30 minutes depending on DNS TTL.
Category 2: Time-boxed fix (4-hour window). Performance degradation (response times 2x or worse than baseline), minor integration failures (batch jobs failing, email notifications not sending), permission errors on file operations. The team has 4 hours to diagnose and fix. If unresolved in 4 hours, rollback.
Category 3: Fix forward (no rollback). Cosmetic issues, non-critical monitoring gaps, log formatting differences, minor configuration adjustments. These get ticketed and fixed during business hours.
# Step 1: Revert DNS to on-prem IPs
aws route53 change-resource-record-sets –hosted-zone-id Z1234567890 –change-batch ‘{
  “Changes”: [{
    “Action”: “UPSERT”,
    “ResourceRecordSet”: {
      “Name”: “app1.meridian.cloud”,
      “Type”: “A”,
      “TTL”: 300,
      “ResourceRecords”: [{“Value”: “10.100.1.50”}]
    }
  }]
}’

# Step 2: Re-enable writes on on-prem Oracle database
sqlplus sys/password@onprem_db as sysdba <<EOF
ALTER TABLESPACE users READ WRITE;
ALTER TABLESPACE patient_data READ WRITE;
EOF

# Step 3: Restart on-prem application servers
$ ssh onprem-app1 'sudo systemctl restart meridian-api.service'$ ssh onprem-app2 'sudo systemctl restart meridian-web.service'
# Step 4: Verify on-prem is serving traffic
$ curl -s -o /dev/null -w '%{http_code}' http://10.100.1.50:8080/health[/gsl_terminal]


<p class="wp-block-paragraph"><mark style="background-color:#fde8e0;padding:2px 4px;">The most important rule: never shut down the on-prem source until the cloud workload has been stable for at least 30 days. Vikram kept on-prem running for 90 days after the final wave. This cost INR 24.6 lakh in double-run fees, but it meant every rollback was possible until the team was confident the cloud deployment was solid.</mark>


<h2 class="wp-block-heading">Redesigning Monitoring and Alerting</h2>


<p class="wp-block-paragraph">Vikram’s on-prem monitoring stack was Nagios with 1,200 service checks and Zabbix for infrastructure metrics. Neither tool was designed for cloud resources. EC2 instances auto-scale, IP addresses change, and managed services like RDS and Lambda have no agent to install. Vikram’s team tried extending Nagios to monitor AWS and spent 2 weeks fighting with NRPE agent configurations on EC2 instances before accepting that a cloud-native approach was necessary.


<ul class="wp-block-list" style="padding-left:2em;">

<li><strong>Run old and new monitoring in parallel for 4 weeks minimum.</strong> Do not shut down Nagios until CloudWatch (or Datadog, or Grafana Cloud) has been alerting correctly for at least 4 weeks. Vikram decommissioned Nagios on day one and was blind to a memory leak for 3 days.</li>


<li><strong>Set up CloudWatch alarms for every critical metric.</strong> CPU above 80% for 5 minutes, memory above 90%, disk above 85%, 5xx error count above 10 per minute, database connections above 80% of max, replication lag above 60 seconds.</li>

</ul>


[gsl_terminal type="command" title="Create CloudWatch alarms for critical EC2 metrics"]
# CPU utilization alarm
aws cloudwatch put-metric-alarm \
  –alarm-name “meridian-app1-high-cpu” \
  –metric-name CPUUtilization \
  –namespace AWS/EC2 \
  –dimensions Name=InstanceId,Value=i-0abc123def456 \
  –statistic Average \
  –period 300 \
  –threshold 80 \
  –comparison-operator GreaterThanThreshold \
  –evaluation-periods 2 \
  –alarm-actions arn:aws:sns:ap-south-1:123456789:meridian-alerts

# RDS database connections alarm
aws cloudwatch put-metric-alarm \
  –alarm-name “meridian-db-connections-high” \
  –metric-name DatabaseConnections \
  –namespace AWS/RDS \
  –dimensions Name=DBInstanceIdentifier,Value=meridian-patient-db \
  –statistic Average \
  –period 300 \
  –threshold 150 \
  –comparison-operator GreaterThanThreshold \
  –evaluation-periods 1 \
  –alarm-actions arn:aws:sns:ap-south-1:123456789:meridian-alerts
- Build custom dashboards from day one. A single CloudWatch dashboard showing all critical services, their health status, error rates, and latency. Vikram’s team built 3 dashboards: application health (API response times, error rates, active users), infrastructure health (CPU, memory, disk, network), and cost tracking (daily spend by service, month-over-month comparison).
- Set up log aggregation. On-prem, logs lived on each server’s local disk. In the cloud, stream everything to CloudWatch Logs or a centralized logging platform (ELK, Datadog Logs, Grafana Loki). Vikram’s team spent a week after Wave 2 hunting for error logs on individual EC2 instances before realizing they had not configured log streaming.
$ sudo yum install amazon-cloudwatch-agent -y
$ sudo tee /opt/aws/amazon-cloudwatch-agent/etc/custom-config.json << 'CWCONFIG'{
  "logs": {
    "logs_collected": {
      "files": {
        "collect_list": [
          {
            "file_path": "/var/log/meridian/app.log",
            "log_group_name": "/meridian/app1",
            "log_stream_name": "{instance_id}",
            "timestamp_format": "%Y-%m-%d %H:%M:%S"
          },
          {
            "file_path": "/var/log/nginx/error.log",
            "log_group_name": "/meridian/nginx-errors",
            "log_stream_name": "{instance_id}"
          }
        ]
      }
    }
  }
}
CWCONFIG

$ sudo /opt/aws/amazon-cloudwatch-agent/bin/amazon-cloudwatch-agent-ctl -a fetch-config -m ec2 -s -c file:/opt/aws/amazon-cloudwatch-agent/etc/custom-config.json[/gsl_terminal]


<h2 class="wp-block-heading">Backup and Disaster Recovery Redesign</h2>


<p class="wp-block-paragraph">On-prem, Vikram’s DR strategy was a second rack in a different colocation facility with weekly tape shipments. Recovery time objective (RTO) was 14 hours. Recovery point objective (RPO) was 7 days (the last tape shipment). In practice, their DR test succeeded only 60% of the time because tape restores failed due to media degradation or incompatible firmware versions.


<p class="wp-block-paragraph">Cloud changed everything about DR. The new strategy cut RTO from 14 hours to 45 minutes and RPO from 7 days to 1 hour.


<ul class="wp-block-list" style="padding-left:2em;">

<li><strong>RDS automated backups with point-in-time recovery.</strong> Continuous backups with transaction log archiving every 5 minutes. Vikram could restore the Oracle database to any point in the last 35 days with 1-second granularity. RPO for databases dropped from 7 days to 5 minutes.</li>


<li><strong>Cross-region RDS read replicas for DR.</strong> The patient records database had a read replica in ap-south-2 (Hyderabad region, once available) with asynchronous replication lag under 30 seconds. In a regional failure, promoting the replica took 15 minutes.</li>


<li><strong>EBS snapshots with lifecycle policies.</strong> Daily snapshots retained for 30 days, weekly snapshots retained for 90 days, monthly snapshots retained for 1 year. Total snapshot storage cost: INR 8,400 per month for 14 TB of data.</li>


<li><strong>Infrastructure as Code for environment rebuild.</strong> The entire cloud infrastructure was defined in Terraform. In a complete disaster, Vikram’s team could rebuild the full environment in a new region by running <code>terraform apply</code>. They tested this quarterly and consistently achieved full rebuild in under 2 hours.</li>

</ul>


[gsl_terminal type="command" title="Verify RDS backup configuration and retention"]
aws rds describe-db-instances –db-instance-identifier meridian-patient-db –query ‘DBInstances[0].{
  BackupRetention: BackupRetentionPeriod,
  BackupWindow: PreferredBackupWindow,
  MultiAZ: MultiAZ,
  StorageEncrypted: StorageEncrypted,
  LatestRestoreTime: LatestRestorableTime
}’
1{
2    “BackupRetention”: 35,
3    “BackupWindow”: “03:00-04:00”,
4    “MultiAZ”: true,
5    “StorageEncrypted”: true,
6    “LatestRestoreTime”: “2026-04-15T06:12:00+00:00”
7}
aws rds restore-db-instance-to-point-in-time \
  –source-db-instance-identifier meridian-patient-db \
  –target-db-instance-identifier meridian-patient-db-dr-test \
  –restore-time 2026-04-15T05:00:00Z \
  –db-instance-class db.r6g.xlarge \
  –availability-zone ap-south-1b
Test your cloud DR procedure at least once before decommissioning on-prem. Vikram’s team ran a full DR drill in month 6: shut down the primary region’s RDS instance, promoted the cross-region replica, rebuilt the application tier from Terraform in the DR region, and validated the complete application stack. The drill took 47 minutes. The old tape-based DR took 14 hours and failed 40% of the time.
The First 90 Days: Post-Migration Optimization
Free to use, share it in your presentations, blogs, or learning materials.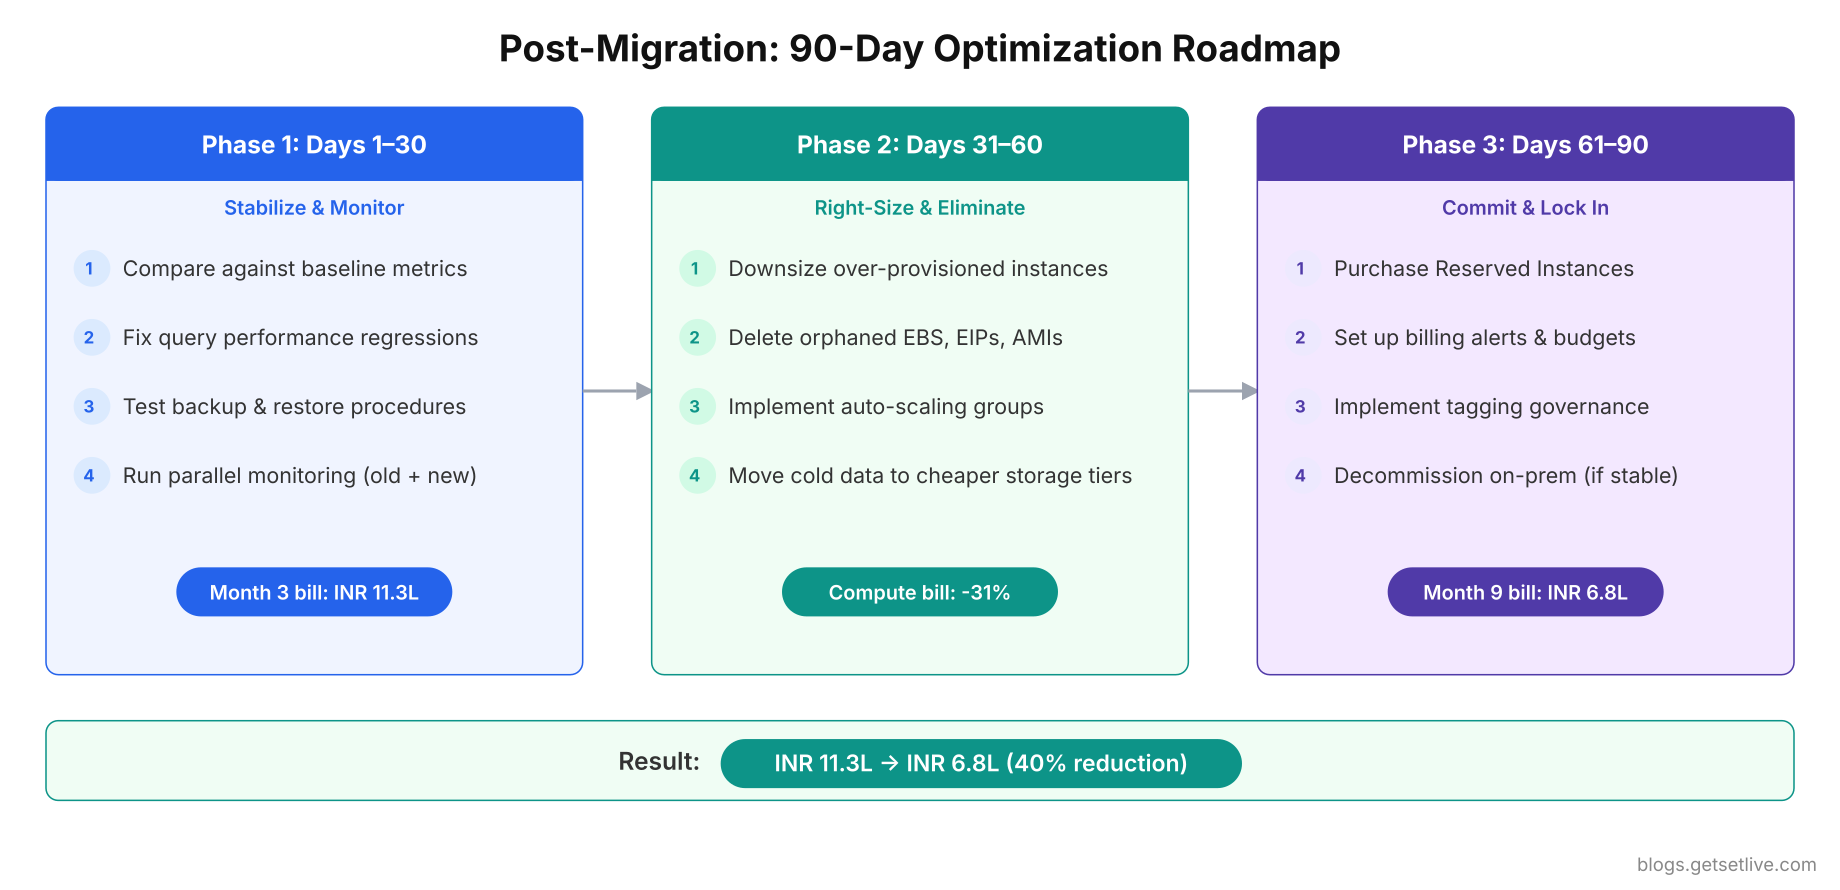
The first 90 days after the final wave is when the real work of cloud optimization begins. Migration gets your workloads running. Optimization makes them efficient. Vikram’s month-3 AWS bill of INR 11.3 lakh dropped to INR 6.8 lakh by month 9 through systematic right-sizing, reserved instance commitments, and eliminating waste.
Days 1 to 30: Stabilize and Monitor
The first month is about stability, not optimization. Resist the urge to right-size instances immediately. You need at least 2 to 4 weeks of production data to make informed sizing decisions.
- Watch for performance regressions. Compare application response times against the baselines captured before migration. Vikram’s Java microservices showed 23% higher p99 latency in the cloud. The root cause was garbage collection pauses on the default JVM settings. The on-prem servers had 32 GB RAM with G1GC tuned for large heaps. The EC2 instances had 16 GB with default GC settings. Matching the GC configuration resolved the regression.
- Monitor database query performance. Query plans change between on-prem and cloud database engines. Index strategies that worked on-prem may not translate. Vikram’s Oracle RDS instance had 3 queries that ran 5x slower than on-prem because the optimizer chose different execution plans. Running
EXEC DBMS_STATS.GATHER_SCHEMA_STATSand rebuilding 2 indexes resolved the issue. - Verify backup and restore procedures. Do not assume cloud backups work. Test a restore within the first week. Vikram’s team discovered that their EBS snapshot restore changed the volume’s device name, which broke the mount point in /etc/fstab. The server booted into emergency mode after a routine snapshot restore test.
# Pull response time percentiles from CloudWatch (last 7 days)
aws cloudwatch get-metric-statistics \
  –namespace Meridian/API \
  –metric-name ResponseTime \
  –dimensions Name=Application,Value=patient-api \
  –start-time $(date -d ‘7 days ago’ -u +%Y-%m-%dT%H:%M:%S) \
  –end-time $(date -u +%Y-%m-%dT%H:%M:%S) \
  –period 86400 \
  –statistics Average p50 p99 \
  –output table

# Compare against baseline file
$ echo “=== Pre-Migration Baseline ===”$ cat /opt/baseline/response_times_summary.txt$ echo “=== Current Cloud Performance ===”$ curl -s http://localhost:8080/metrics | grep response_time
Days 31 to 60: Right-Size and Eliminate Waste
After 30 days of production metrics, you have enough data to make sizing decisions. Most teams over-provision during migration because they match the on-prem specs 1:1. Cloud instances do not need to be sized the same way.
 1for instance in $(aws ec2 describe-instances –filters Name=instance-state-name,Values=running –query ‘Reservations[*].Instances[*].InstanceId’ –output text); do
 2  AVG_CPU=$(aws cloudwatch get-metric-statistics \
 3    –namespace AWS/EC2 \
 4    –metric-name CPUUtilization \
 5    –dimensions Name=InstanceId,Value=$instance \
 6    –start-time $(date -d ’14 days ago’ -u +%Y-%m-%dT%H:%M:%S) \
 7    –end-time $(date -u +%Y-%m-%dT%H:%M:%S) \
 8    –period 1209600 \
 9    –statistics Average \
10    –query ‘Datapoints[0].Average’ –output text 2>/dev/null)
11  TYPE=$(aws ec2 describe-instances –instance-ids $instance –query ‘Reservations[0].Instances[0].InstanceType’ –output text)
12  echo “$instance ($TYPE): avg CPU ${AVG_CPU}%”
13done | sort -t: -k2 -n
14i-0abc123def456 (m5.2xlarge): avg CPU 8.3%
15i-0def456abc789 (m5.xlarge): avg CPU 12.1%
16i-0ghi789jkl012 (r5.xlarge): avg CPU 34.7%
17i-0mno345pqr678 (c5.xlarge): avg CPU 67.2%
That m5.2xlarge at 8.3% CPU is massively over-provisioned. Vikram downsized it to m5.large (4x smaller) and saved INR 28,000 per month on that single instance. Across all 38 workloads, right-sizing reduced the compute bill by 31%.
- Delete orphaned resources. EBS volumes detached from instances, unused Elastic IPs, old AMIs with associated snapshots, unused load balancers, empty S3 buckets with lifecycle policies that never trigger. Vikram found INR 1.4 lakh per month in orphaned resources that were created during migration testing and never cleaned up.
- Implement auto-scaling for variable workloads. Vikram’s patient portal had 3x traffic during morning hours (8 AM to 11 AM) compared to overnight. Running 6 EC2 instances 24/7 to handle morning peak wasted 60% of compute overnight. Auto-scaling groups that scaled from 2 instances at night to 6 during peak saved INR 42,000 per month.
- Switch storage tiers. Vikram had 3 TB of patient documents in S3 Standard that were rarely accessed after 90 days. Moving files older than 90 days to S3 Infrequent Access and files older than 1 year to S3 Glacier saved 62% on storage costs for that bucket.
aws s3api put-bucket-lifecycle-configuration –bucket meridian-patient-documents –lifecycle-configuration ‘{
  “Rules”: [{
    “ID”: “TierOldDocuments”,
    “Status”: “Enabled”,
    “Filter”: {“Prefix”: “”},
    “Transitions”: [
      {“Days”: 90, “StorageClass”: “STANDARD_IA”},
      {“Days”: 365, “StorageClass”: “GLACIER”}
    ]
  }]
}’
Days 61 to 90: Commit and Lock In Savings
After 60 days of right-sized, optimized workloads, you have enough confidence in the resource requirements to commit to reserved pricing.
- Purchase Reserved Instances or Savings Plans. 1-year commitments save 30 to 40% over on-demand pricing. 3-year commitments save 50 to 60%. Vikram committed to 1-year reserved instances for his steady-state workloads (databases, core application servers) and kept variable workloads on on-demand with auto-scaling. The reserved instance purchases alone saved INR 2.1 lakh per month.
- Set up billing alerts and budgets. Configure AWS Budgets to alert at 80% and 100% of monthly target. Vikram set his monthly budget to INR 7 lakh with alerts at INR 5.6 lakh (80%) and INR 7 lakh (100%). The first time the 80% alert fired at day 22 of the month, he caught a misconfigured auto-scaling group that was launching 20 instances instead of 6.
- Implement tagging governance. Every resource tagged with Project, Environment, Owner, and CostCenter. Without consistent tags, cost allocation is impossible. Vikram’s team spent 3 days retroactively tagging 340 resources after the finance team asked “Which project is consuming 40% of the AWS bill?” and nobody could answer.
aws budgets create-budget –account-id 123456789012 –budget ‘{
  “BudgetName”: “Monthly-Cloud-Spend”,
  “BudgetLimit”: {“Amount”: “8500”, “Unit”: “USD”},
  “TimeUnit”: “MONTHLY”,
  “BudgetType”: “COST”
}’ –notifications-with-subscribers ‘[{
  “Notification”: {
    “NotificationType”: “ACTUAL”,
    “ComparisonOperator”: “GREATER_THAN”,
    “Threshold”: 80,
    “ThresholdType”: “PERCENTAGE”
  },
  “Subscribers”: [{
    “SubscriptionType”: “EMAIL”,
    “Address”: “vikram@meridian-health.in”
  }]
}]’
What Meridian Would Do Differently
Fourteen months after the first planning meeting, Vikram’s migration was complete. 34 workloads ran in AWS. 4 were retired. The COBOL billing engine remained on a single on-prem server connected via Direct Connect. Here are the honest numbers from the retrospective.
- Planned timeline: 8 months. Actual: 14 months.
- Planned budget: INR 42 lakh. Actual: INR 78 lakh (including double-run, consulting, training, licensing).
- Month 3 AWS bill: INR 11.3 lakh. Month 9 AWS bill (post-optimization): INR 6.8 lakh.
- On-prem colocation cost: INR 8.2 lakh/month. Optimized cloud cost: INR 6.8 lakh/month. Net monthly savings: INR 1.4 lakh.
- DR recovery time: On-prem 14 hours (60% success rate). Cloud: 47 minutes (100% success rate in quarterly tests).
- Rollbacks executed: 2 (one in Wave 2 for a permission issue, one in Wave 3 for a stored procedure incompatibility).
- Post-migration incidents: 14 in the first 90 days, 3 in the next 90 days.
If Vikram could start over, here is what he would change.
- Audit Oracle licensing before writing the business case. The INR 3.8 lakh monthly licensing surprise invalidated every cost projection. If he had known about Oracle cloud licensing costs upfront, he would have budgeted for PostgreSQL migration as part of the project, which his team eventually did in month 11 anyway.
- Start cloud training 6 months before migration, not 3. The team’s learning curve during live migration caused avoidable incidents. Two production outages were directly caused by IAM policy misconfigurations that a trained engineer would have caught.
- Set up Infrastructure as Code from day one. Console-built resources are unreproducible. The 2 weeks spent manually recreating the DR environment could have been a single Terraform command.
- Budget for 14 months of double-run, not 6. The colocation contract had a 3-month exit notice. Even after the final wave, Vikram kept on-prem running for 90 days as a safety net. Total double-run cost was INR 1.14 crore, which was the single largest unplanned expense.
- Run dress rehearsals for every wave, not just Wave 3. The two rollbacks in Wave 2 and Wave 3 could have been prevented with pre-cutover testing in a staging cloud environment.
Cloud migration is not an infrastructure project. It is a business transformation that touches licensing, compliance, team skills, operational processes, disaster recovery, and cost governance. The organizations that treat it as “just moving VMs” are the ones that end up in the 75% failure statistic.
References
- AWS, Troubleshooting Latency Issues in AWS Database Migration Service, 2025
- Microsoft, Performance Considerations When Migrating from On-Prem to PaaS Database, 2025
- DigitalOcean, Cloud Migration Checklist: Your Pre- and Post-Migration Guide, 2025
- Naviant, Cloud Change Management: 5 Strategies for Successful Migration, 2025
- DataBank, A Complete Guide to Cloud Repatriation, 2025
- BoatyardX, The Hidden Costs of Cloud Migration: Pitfalls and Solutions, 2025
Frequently Asked Questions
Start with 3 to 5 workloads in the pilot wave, then scale to 8 to 12 per wave as your team gains confidence. Each wave should contain workloads with similar dependency profiles and risk levels. Never mix high-risk database migrations with low-risk application moves in the same wave. Allow 2 weeks of stability between waves to catch delayed issues before introducing new variables.
Keep the on-prem environment fully operational for at least 30 to 90 days after the final workload cutover. This is your rollback safety net. Budget for this double-run period explicitly in the migration cost estimate. For regulated industries like healthcare and finance, 90 days is the recommended minimum. Shutting down on-prem prematurely eliminates your ability to recover from post-migration issues that surface weeks after cutover.
Start with right-sizing: most teams over-provision by 40 to 60% during migration. After 30 days of metrics, downsize instances with average CPU under 20%. Delete orphaned resources like detached EBS volumes and unused Elastic IPs. Implement auto-scaling for variable workloads. Move infrequently accessed data to cheaper storage tiers like S3 Infrequent Access or Glacier. After 60 days of stable usage, purchase Reserved Instances or Savings Plans for steady-state workloads to save 30 to 60%.
Cloud DR replaces tape backups and physical secondary sites with automated snapshots, cross-region replication, and Infrastructure as Code. RDS automated backups provide point-in-time recovery with 5-minute granularity. EBS snapshots can be copied to other regions automatically. Terraform or CloudFormation can rebuild the entire environment in a new region in under 2 hours. Most organizations see RTO improve from 14 to 24 hours on-prem to under 1 hour in the cloud, with RPO improving from days to minutes.
Do not replace monitoring tools on day one. Run your existing monitoring (Nagios, Zabbix) in parallel with the new cloud-native tool (CloudWatch, Datadog, Grafana Cloud) for at least 4 weeks. Verify that the new tool catches every alert the old tool would have caught. Only decommission the legacy monitoring after confirming zero gaps. Teams that shut down Nagios immediately have reported 2 to 5 days of blind spots where production issues went undetected.